Pallikaranai Marsh is a 500 hectares marshland in South Chennai. It is situated adjacent to the Bay of Bengal, about 20 kilometers south of the city center. It is one of the 94 identified wetlands under the National Wetland Conservation & Management Programme (NWCMP) operationalized by the Government of India.
Important Note: Almost all of the research and restoration work on Pallikaranai Marsh Land has been due to the efforts of the Chennai based Care Earth Trust founded by Dr. Jayashree. Their multi-year effect effort led the Government of Tamilnadu to form the Conservation Authority of Pallikaranai Marshlands.
Data of this article has been due to the meticulous research work done by Care Earth Trust, Visualization done by MOAD with funding from Chennai City Connect.
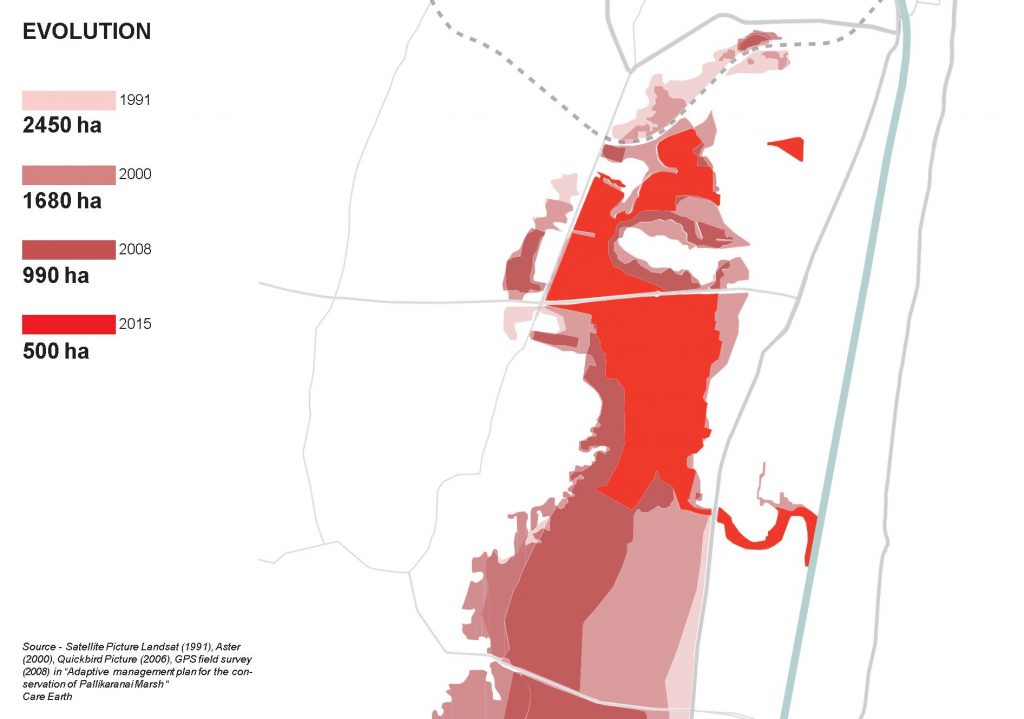
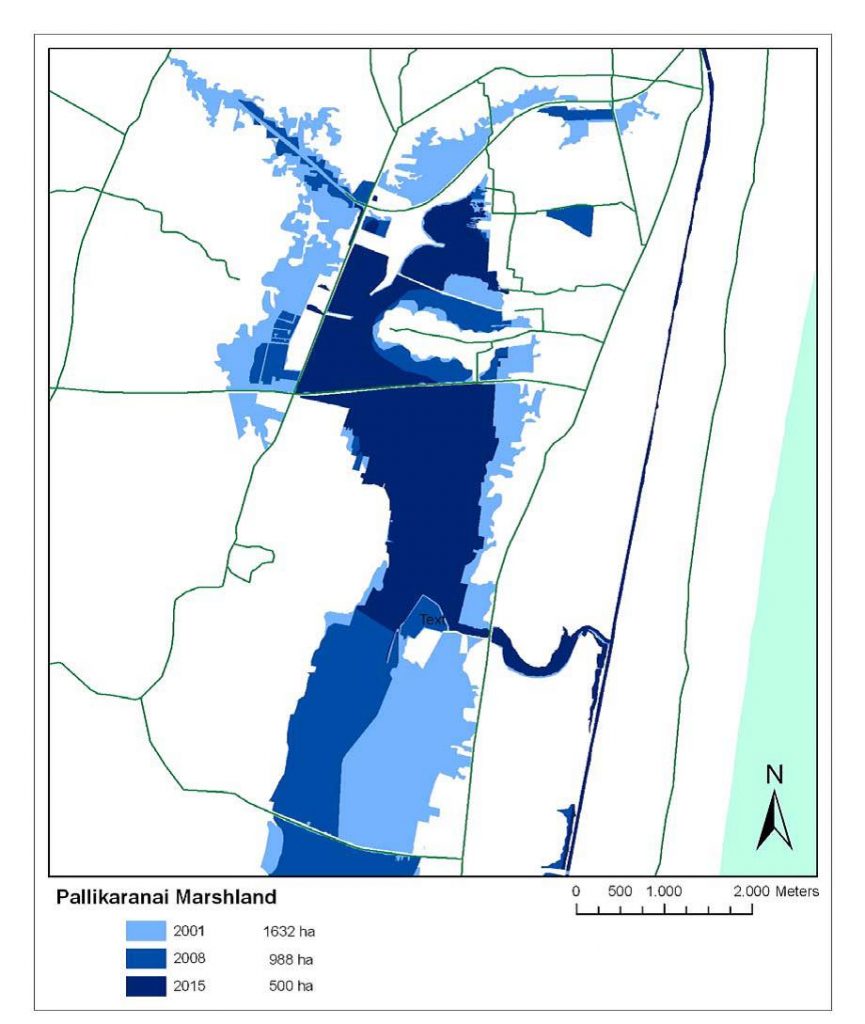
Historical Change in Landuse of Pallikaranai Marshland
The Pallikaranai marshland has shrunk in size from 2450 hectares to a meager 500 hectares in 2015.
Why is Pallikarnai Marsh Important to Chennai
Biodiversity in Pallikaranai Marsh
According to the experts, the Pallikaranai Marshland is home to about 355 species of flora and fauna.
The marshland is home to 5 Crustaceans (crabs & prawns), 7 butterflies, 9 molluscans (snails and clams), 10 mammals, 9 amphibians (frogs & toads), 21 reptiles, 49 fishes, 125 bird species and 120 plant species.
Biodiversity of Pallikaranai Marsh is visible by the presence of species representing various faunal groups, of which birds, fishes, and reptiles are the most prominent. It is the natural habitat to some of the most endangered reptiles such as Russell’s viper and birds such as the Glossy Ibis, Pheasant-tailed Jacana, etc.
Biggest Threats and Challenges to the Pallikarnai Marshland
In the last decades, Pallikarnai Marsh Land has received threats from a range of issues.
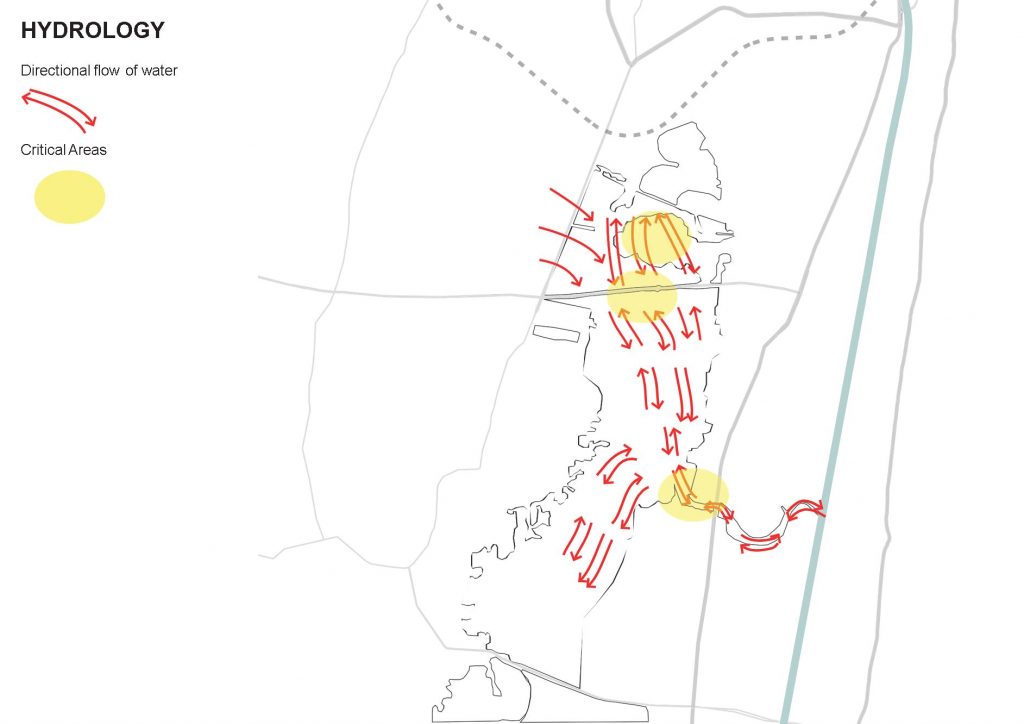
Hydrology
Hydrology is the primary challenge of Pallikarnai Marshland. The constraint points are the 200ft radial road that divided the marshland into the north and south. In an ideal situation, the road should not have existed. Now that it is, it must have been elevated according to many experts. Currently, the water drains from the Northern side to the Southern side via 3 culverts. However, during peak monsoon, these have proved to be insufficient.
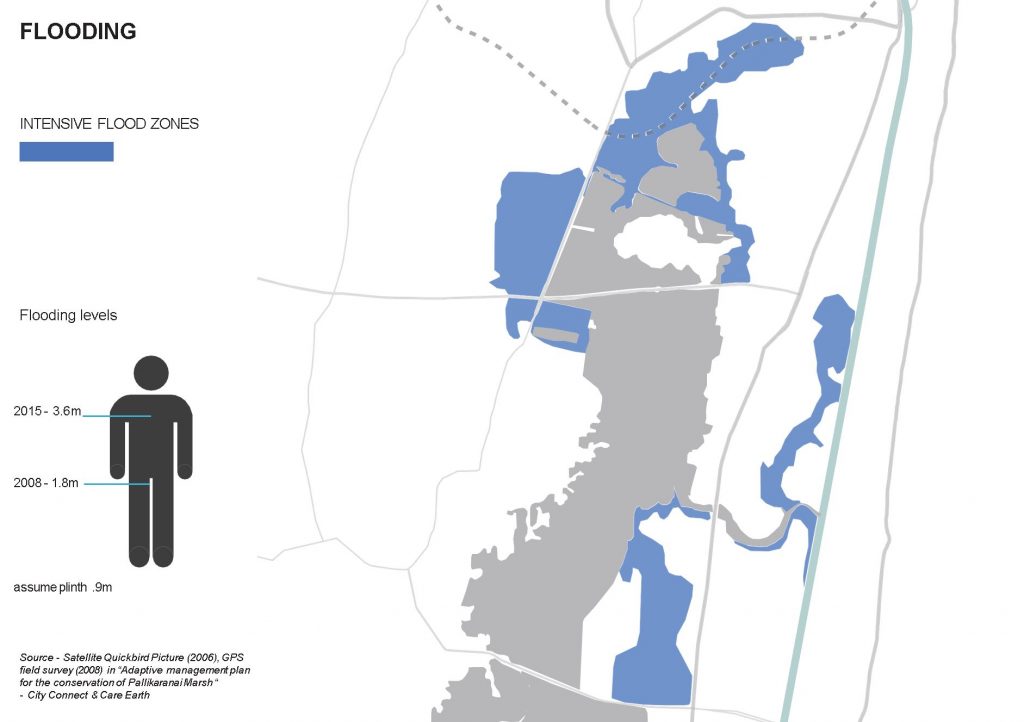
Flooding
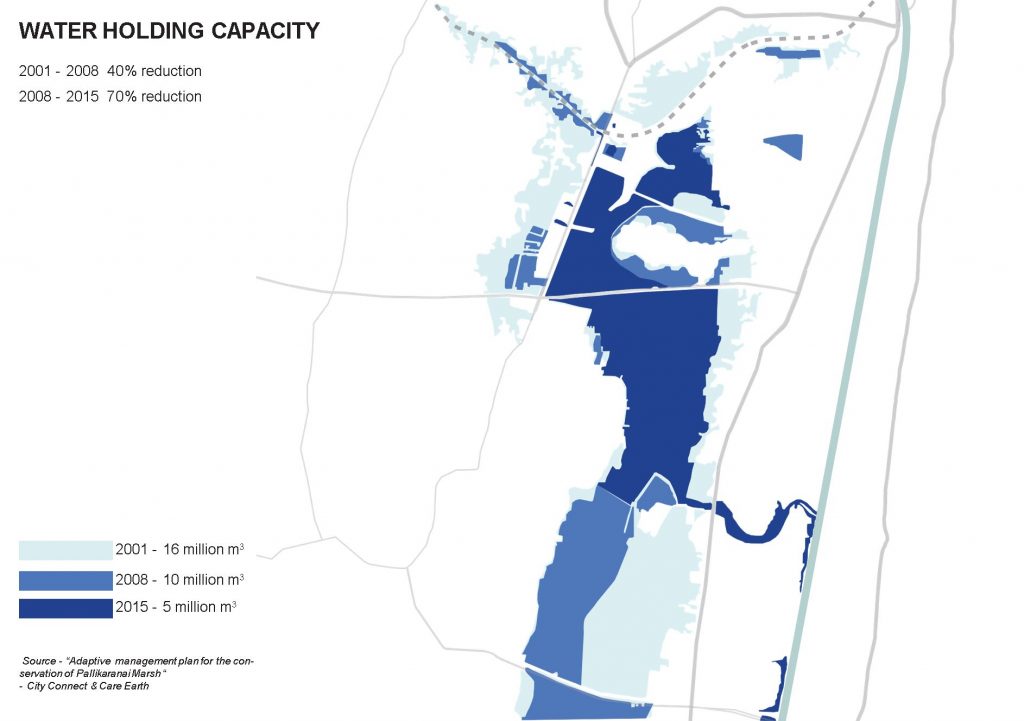
One of the major impacts due to the shrinking marsh size is the amount of water that is displaced. It is estimated that between 2001 and 2015, there was a drop of 70% in the water retention capacity of the Pallikaranai marsh. This water only ends up the adjacent low lying areas like Velachery, Pallikaranai, Narayanapuram etc… It is estimated that about 9 million meter cube of water space has now been encroached upon.
The shrinking of the marshland has created a ripple effect on the areas surrounding the marshland. The map below illustrates the depth of flooding due to this:
The water-retaining capacity of the marshland has come down significantly over the last few years as detailed in the map below.
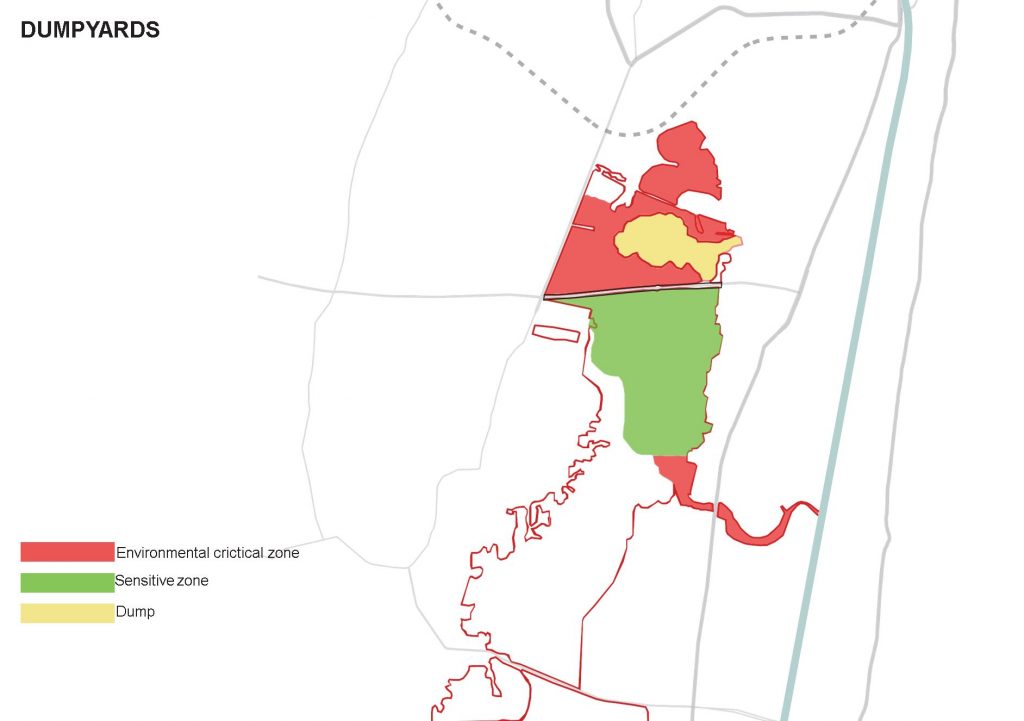
Dump yard
Chennai city generates about 5000 tonnes of Municipal Solid Waste every day. This has been the generation rate for almost the last 7-8 years. About 2300 tonnes of this waste is dumped in Perungudi Dumpyard within the Pallikaranai Marshland. Over the years, the lack of a suitable alternative has lead to a significant increase in the area occupied for dumping waste.
The area indicated by yellow in the map below has only been expanding.
| The Segment of the Marsh | Year | Area (ha) | Perimeter (km) | Edge development |
| Municipal Landfill | 2003 | 50.25* | 5.785 | 2.30 |
| 2005 | 57.54 | 6.046 | 2.24 | |
| Area impacted by garbage/sewage | 2003 | 58.75* | ||
| 2005 | 132.25 | |||
| Northern segment # | 2003 | 227.00 | 12.11 | 2.26 |
| 2005 | 150.56 | 7.6 | 1.74 | |
| Southern segment | 2003 | 284.00 | 9.327 | 1.56 |
| 2005 | 279.65 | 11.8 | 1.99 | |
| Total | 2003 | 620.00 | c. 13.0 – | |
| 2005 | 620.00 | c. 13.0 – |
Edge development is calculated as the deviation of boundary/perimeter of the segment/polygon from the circumference of a circle that has the same area/extent. It is calculated as p/2 (3.14A); where p is the perimeter of the segment/ polygon in metres, A the area of the segment/polygon in square metres (1 ha = 10,000 sq. m); 3.14 = p.
*50.25 + 58.75 = 109 ha recommended as the ‘critical zone’.
# excludes garbage dump and the impacted area.
@The 2003 map was based on details provided by IRS ID PAN + LISS III (March 2001), GPS Field Survey by NIOT (February 2003) and Survey of India toposheet of 1972.
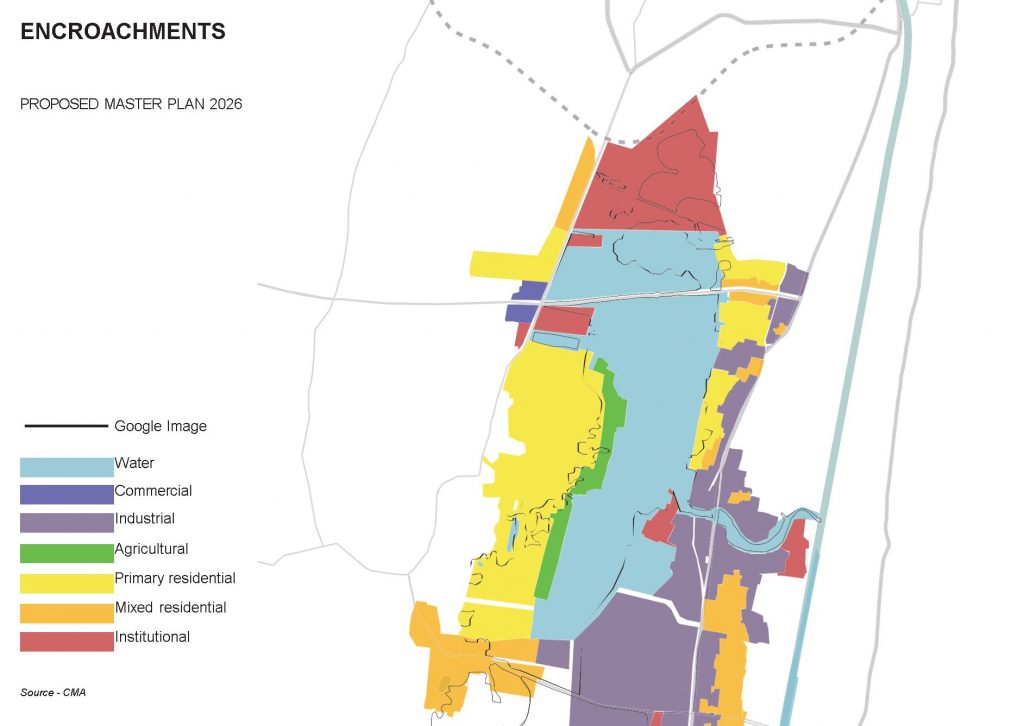
Encroachments
Encroachments over the years has has eaten into the marshland over the last 2-3 decades.
As per the 2026 masterplan, the boundaries allocated to the various land uses must be enforced to protect the marshland.
Vision for Pallikaranai Marshland
As part of the study, the team also looked at reimagining some of the areas within the marshland.
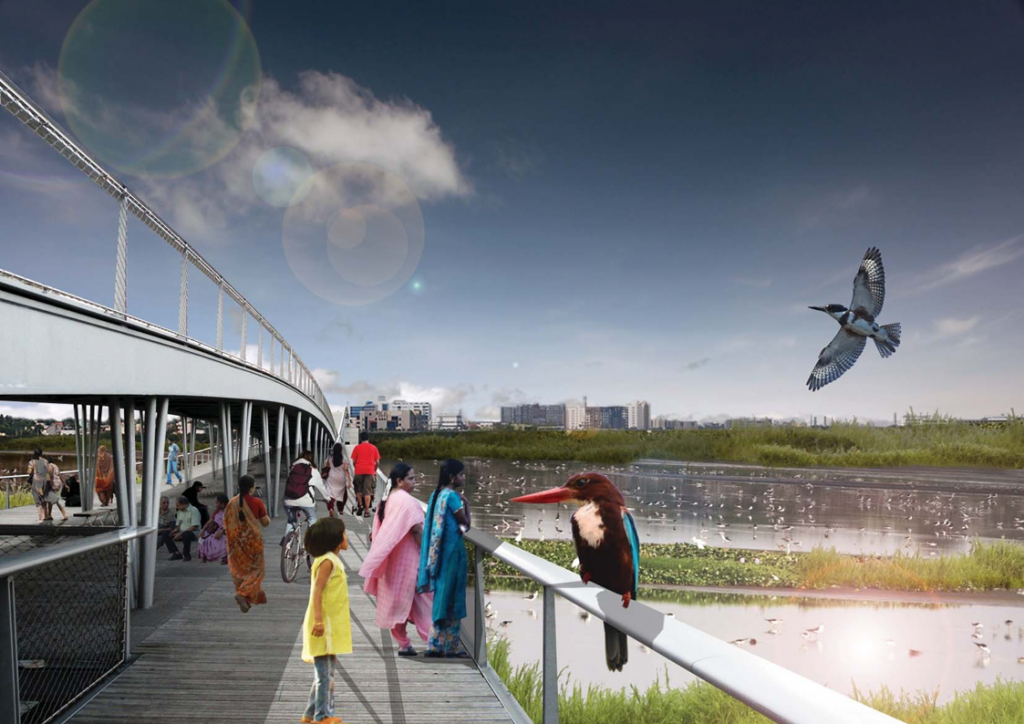
The dump yard itself was revisualised along the lines of the Staten Island, Newyork redesign of a dump yard. The reimagined public space would be a public viewing area with bridges and marsh intersecting each other.
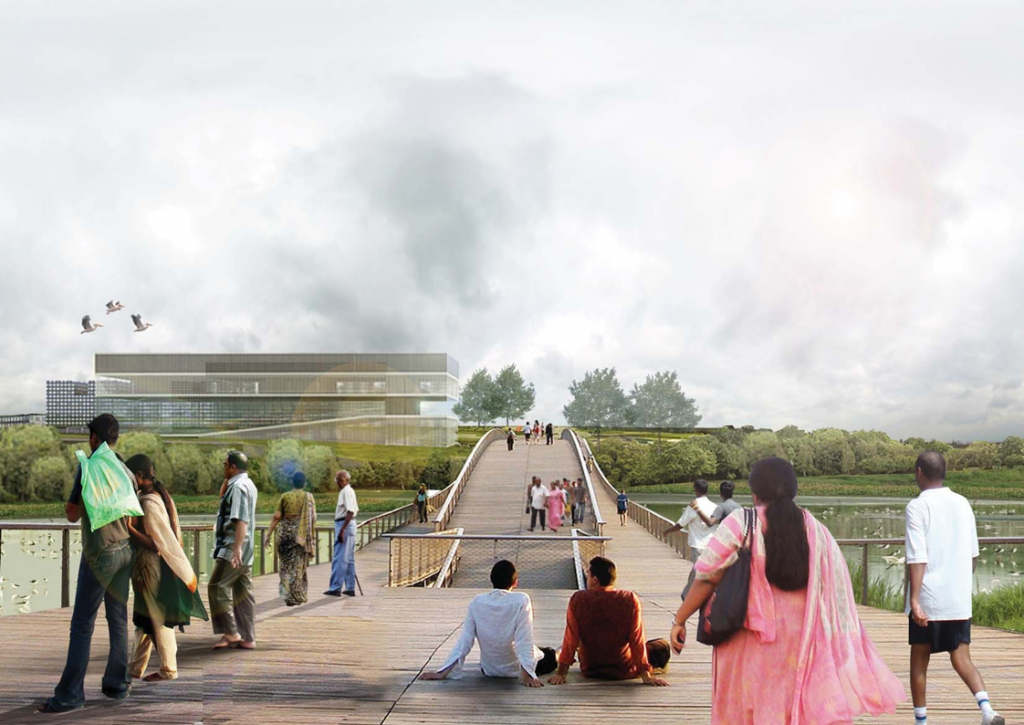
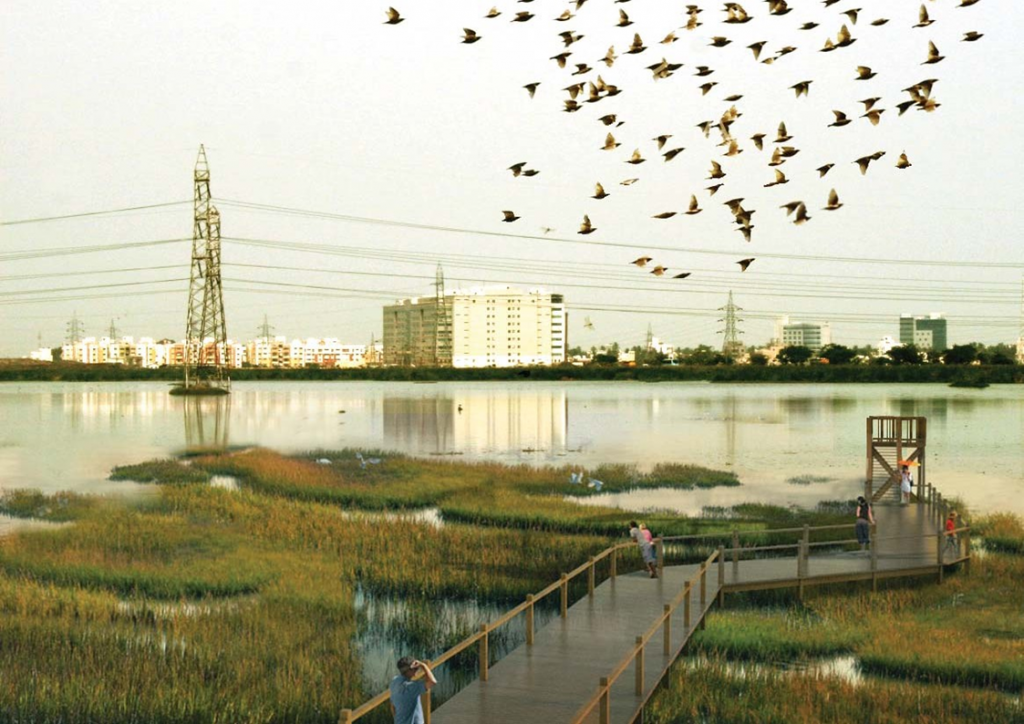
Another idea is to create nature trails with informative signages to indicate species in their habitats.
A pedestrian plaza was also visualized as part of the redesign of the Pallikaranai marshland.
Government Action on Pallikaranai Marshland
Based on work done by Care Earth Trust in collaboration with Chennai City Connect, the Government of Tamilnadu formed the Conservation Authority for Pallikaranai Marshland.
The authority has members from the community, non-profit foundations, corporate representatives from the area among Government stakeholders.

