Metro Water’s monthly well readings show Chennai’s water table swinging by two to four metres a year and recovering fast after good monsoons. The 2003 rainwater harvesting law made that recharge everyone’s duty, but the data also shows how unevenly it works across the city.
The numbers
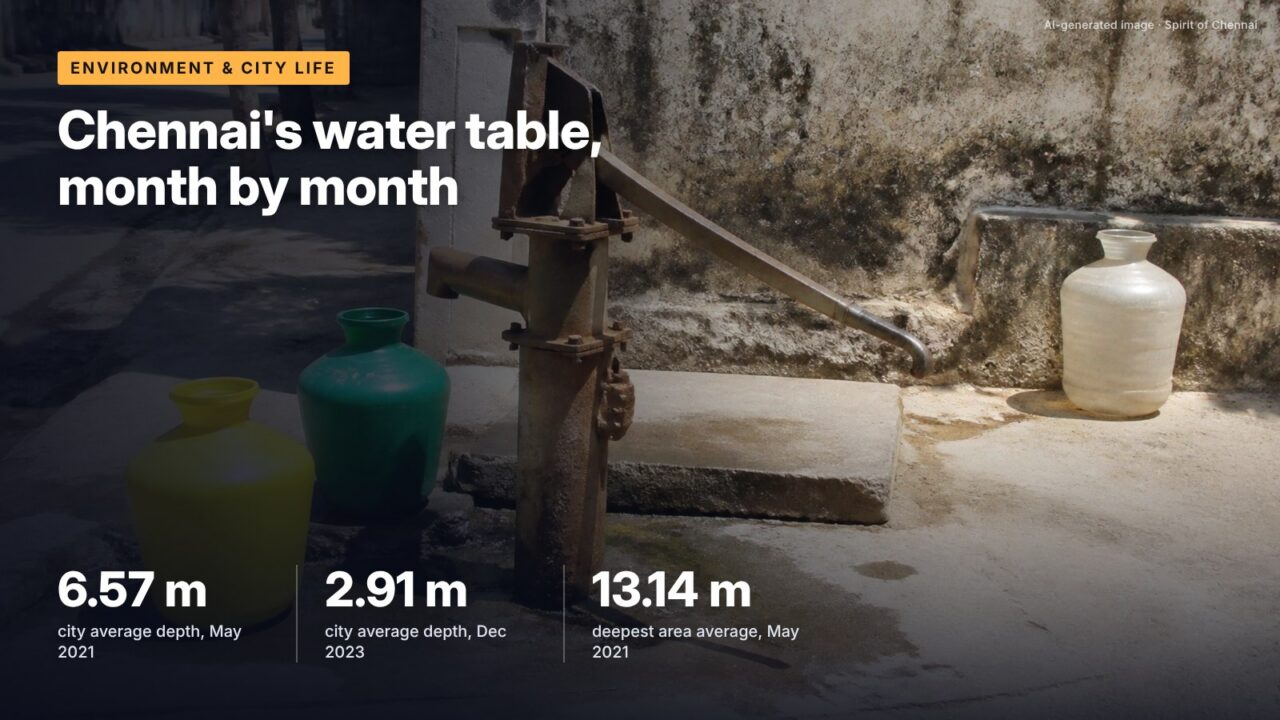
Chennai’s groundwater sat on average 6.57 metres below ground in May 2021, before the monsoon, and 2.91 metres in December 2023, after the heavy rain of Cyclone Michaung. The figures come from Metro Water’s ward-wise monthly groundwater readings, published in machine-readable form for 2021 to early 2024 on the OpenCity portal. They are the most detailed public record of the city’s water table.
The readings show a city whose aquifers respond quickly to rain and fall quickly in summer. That pattern is what the Tamil Nadu Municipal Laws (Second Amendment) Ordinance of 2003 was designed to exploit, by requiring every building to catch rooftop rain and send it underground.
The water table, month by month
| Month | 2021 | 2022 | 2023 | 2024 |
|---|---|---|---|---|
| January | 5.16 | 3.41 | 4.12 | 3.46 |
| March | 5.94 | 4.66 | 4.59 | 4.91 |
| May | 6.57 | 5.44 | 5.46 | n/a |
| July | 6.27 | 5.05 | 5.59 | n/a |
| November | 2.59 | 3.69 | 3.10 | n/a |
| December | 3.45 | 3.93 | 2.91 | n/a |
Source: CMWSSB ward-wise monthly groundwater depth, overall city average, metres below ground level, 2021 to March 2024 (via OpenCity)
A smaller number means water closer to the surface. The deepest point of each year falls between May and July, after the dry months, and the shallowest in November or December, after the northeast monsoon. In 2021 the city average fell to 6.88 metres in June and then rose almost four metres to 2.59 metres in November, a month of very heavy rain. The 2022 and 2023 summers were about a metre shallower than 2021’s, which points to good recharge in between.
Rise in the city’s average water table between June 2021 (6.88 m) and November 2021 (2.59 m) in CMWSSB readings, an example of how fast the shallow aquifer refills after heavy rain.
Some areas sit much deeper
The city average hides wide differences. Metro Water organises its readings by operational area, numbered I to XV in the files (there is no Area II row). In May 2021, Area VI averaged 13.14 metres below ground, the deepest, while Area XIII averaged 3.26 metres. By May 2023, Area VI’s average had improved to 7.43 metres, Area III was 8.42 metres, and Areas XI and XIII were under 4 metres, according to the 2023 readings.
| Area | May 2021 | May 2022 | May 2023 |
|---|---|---|---|
| III | 9.49 | 8.22 | 8.42 |
| VI | 13.14 | 8.51 | 7.43 |
| IX | 8.86 | 6.36 | 7.12 |
| XI | 4.07 | 3.93 | 3.79 |
| XIII | 3.26 | 2.72 | 3.25 |
| City average | 6.57 | 5.44 | 5.46 |
Source: CMWSSB ward-wise monthly groundwater depth, area averages, metres below ground level (via OpenCity)
The files do not name the areas, so this article does not attach locality names to them. The point is the spread: in the same month, the pre-monsoon water table in the deepest area can be two to four times as deep as in the shallowest. Areas with more paved surface, harder rock or heavier pumping take longer to recover.
How to read these readings
The files cover about 190 monitoring locations, each listed with its area and department number, and add sub-total and average rows for each area plus an overall city average. That structure makes them easy to misread. Some wells are marked “Removed”, “Demolished” or “Theft” in certain months, a few cells are blank or malformed, and one 2023 area sub-total contains a spreadsheet error. Averages therefore depend partly on which wells were read that month.
For that reason, month-to-month changes of a few centimetres mean little. Year-on-year comparisons of the same month, and the seasonal swing between May and December, are more reliable. The readings measure depth to water in shallow wells, so they say most about the top aquifer that household borewells and open wells tap.
The 2003 law
The Tamil Nadu Municipal Laws (Second Amendment) Ordinance, 2003, promulgated on 19 July 2003 as Ordinance 4 of 2003, inserted Section 255-A in the Chennai City Municipal Corporation Act, 1919, and similar sections in the laws governing other municipalities, Madurai and Coimbatore. Every owner or occupier must provide a rainwater harvesting structure; government buildings must do so too. If the owner does not, the Commissioner can build it after notice and recover the cost as property tax. And if the structure is not in place by the prescribed date, the building’s water connection is to be disconnected until it is.
The ordinance left the deadline and technical details to rules. Its two levers, recovery through the tax bill and disconnection, are unusually strong for a civic rule, which is why compliance surveys after 2003 were so widespread.
It’s often said rainwater harvesting has permanently raised Chennai’s water table.
The record shows Metro Water’s readings show the water table still drops by two to four metres in most dry seasons and recovers mainly after heavy monsoon rain. Recharge pits shorten the recovery; they do not stop summer decline.
The state picture
Statewide, the Central Ground Water Board’s Dynamic Ground Water Resources of Tamil Nadu 2024 puts annual extractable groundwater at 19.46 billion cubic metres and extraction at 14.45, a stage of extraction of 74.26%. Of 1,202 assessment units (firkas), 392 are over-exploited and 56 critical. The 2023 assessment used 313 taluks as units and found 100 over-exploited, with an extraction stage of 73.91%, so the two years are not directly comparable unit by unit.
For Chennai, groundwater fills part of the gap between demand and piped supply. Metro Water puts city demand at 1,400 MLD against about 1,040 MLD supplied, leaving 360 MLD unmet in its 2023-24 performance report. Much of that gap is drawn from private borewells and tankers, which is why the summer water table matters to households.
What this means for you
- Clean your recharge pit and roof gutters before October; a blocked pit sends rain to the drain instead of the aquifer.
- Check that the harvesting structure is still connected after any renovation; the 2003 law allows disconnection of the water supply where none exists.
- If your borewell runs dry in May or June, that is the normal pre-monsoon low; how far it drops depends on your area.
- Pumping less in March to June helps neighbours too, because shallow aquifers are shared.
What to watch
October to December 2026
The northeast monsoon will decide how much the water table recovers before the 2027 summer.
April to June 2027
The next pre-monsoon low, when the deepest readings of the year are usually recorded.
Checked against official sources on 23 October 2026. Figures and rules change; confirm on the linked official pages before relying on them.
Sources
- Chennai ward-wise groundwater levels, CMWSSB monitoring data 2021 to 2024 (hosted by OpenCity)
- CMWSSB ward-wise monthly groundwater depth, 2023 (CSV)
- Tamil Nadu Municipal Laws (Second Amendment) Ordinance, 2003 (Ordinance 4 of 2003), via CMWSSB
- Report on Dynamic Ground Water Resources of Tamil Nadu 2024, Central Ground Water Board, 2025
- Dynamic Ground Water Resources 2023, Tamil Nadu, Central Ground Water Board, 2024
- Annual Performance Report 2023-24, CMWSSB