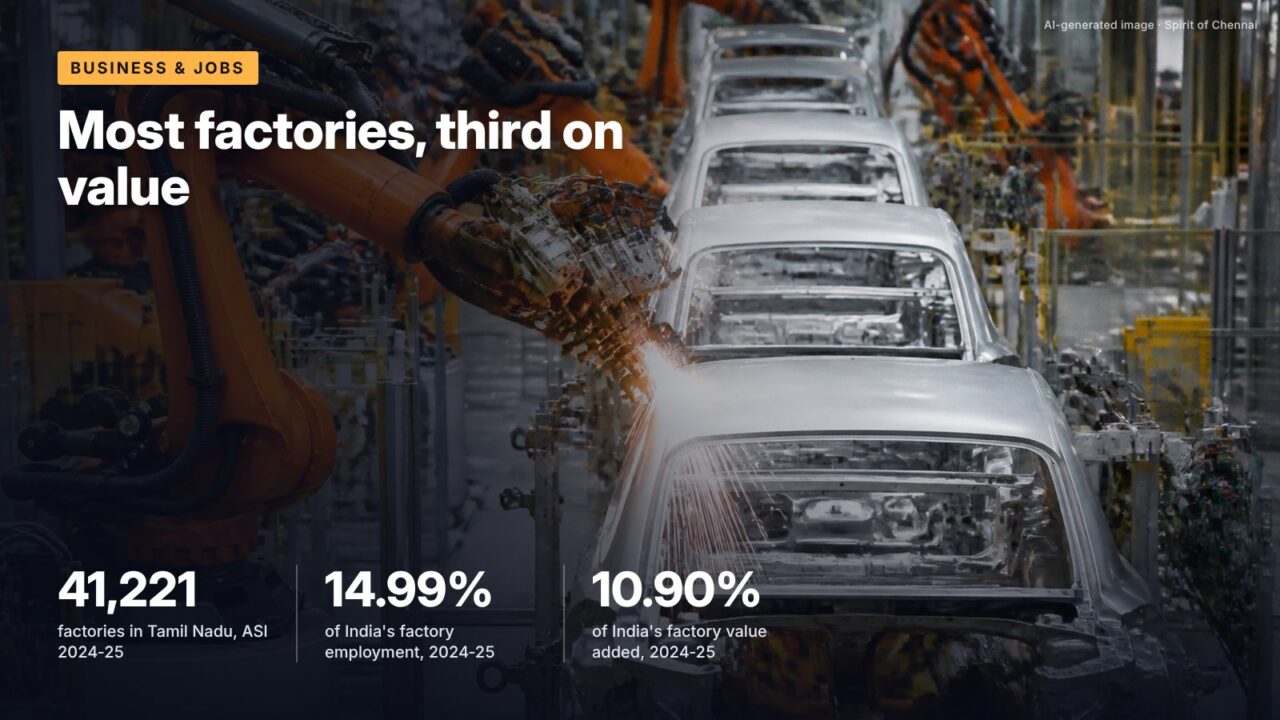
Tamil Nadu has more registered factories and more factory workers than any other state. It does not produce the most value from them. Three years of the Annual Survey of Industries show the gap, and why it matters for wages and investment.
The numbers
The Annual Survey of Industries (ASI) for 2024-25, released on 30 September 2026, counts 41,221 factories in Tamil Nadu, the most of any state and 15.44% of India’s 2,66,931. Tamil Nadu also leads on employment, with 14.99% of the 2.10 crore people engaged in India’s factories. On gross value added (GVA), the value a factory adds to its inputs, it ranks third with 10.90%, behind Maharashtra and Gujarat.
Dividing value-added share by employment share gives a rough measure of output per person. For Tamil Nadu it is 0.73 of the national average; for Maharashtra 1.22 and Gujarat 1.09. Tamil Nadu’s factories are many and labour-using, but on average each worker adds less value than in the two western states. That has held through three survey rounds.
What the survey counts
The ASI is the official census-cum-sample survey of organised manufacturing. It covers factories registered under Sections 2m(i) and 2m(ii) of the Factories Act, 1948, broadly units with 10 or more workers using power or 20 or more without, plus bidi and cigar units and some electricity undertakings. The 2024-25 round covers April 2024 to March 2025, with fieldwork from October 2025 to June 2026. It excludes the millions of tiny unregistered workshops, which is why its factory count is far below the number of enterprises on the MSME Udyam portal.
Tamil Nadu’s shares, three rounds
| Indicator (TN share of India) | 2022-23 | 2023-24 | 2024-25 |
|---|---|---|---|
| Number of factories | 15.66% (1st) | 15.43% (1st) | 15.44% (1st) |
| Persons engaged | 15.00% (1st) | 15.24% (1st) | 14.99% (1st) |
| Gross value added | 10.33% (3rd) | 10.26% (3rd) | 10.90% (3rd) |
| Output | 9.97% (3rd) | 10.11% (3rd) | not released |
| Fixed capital | 7.93% (4th) | 8.09% (3rd) | not released |
Source: PIB/MoSPI releases of ASI results for 2022-23 (30.09.2024), 2023-24 (27.08.2025) and 2024-25 (30.09.2026), Table 4 and state share tables
The steadiest gap is capital. In 2023-24, Tamil Nadu held 8.09% of the fixed capital in India’s factories against 15% of the jobs; Gujarat held 19.53% of the capital with 13.07% of the jobs. Capital-heavy industries such as refining, chemicals and basic metals push up value added per worker, and they are concentrated on the western coast. Tamil Nadu’s base leans towards motor vehicles, auto parts, textiles, garments and electronics assembly, which employ more people per rupee of capital.
Rise in Tamil Nadu’s share of national factory GVA between 2023-24 and 2024-25, from 10.26% to 10.90%, while its employment share slipped from 15.24% to 14.99% (ASI 2024-25 release).
The 2024-25 shift
The latest round is the first in three years in which Tamil Nadu’s value-added share rose clearly while its employment share fell. That combination means value added per worker in the state improved relative to the country. The release does not explain it, and a single year can reflect price movements in a few industries. Motor vehicles is among the five industries that together made up more than 45% of national manufacturing GVA in 2024-25, and Tamil Nadu is the largest exporter of both cars and auto components by the commerce ministry’s 2023-24 figures.
Nationally, the 2024-25 survey found GVA up 9.59% and invested capital up 11.10% on 2023-24, with employment up 7.19%. Applying Tamil Nadu’s shares to the national totals gives roughly 31.5 lakh people engaged in the state’s factories and about ₹2.94 lakh crore of GVA, approximations that assume the published shares apply exactly.
| State (2024-25) | Share of factories | Share of persons engaged | Share of GVA | GVA share ÷ employment share |
|---|---|---|---|---|
| Maharashtra | 10.26% | 13.08% | 15.92% | 1.22 |
| Gujarat | 12.39% | 12.99% | 14.10% | 1.09 |
| Tamil Nadu | 15.44% | 14.99% | 10.90% | 0.73 |
| Uttar Pradesh | 9.35% | 8.72% | 6.64% | 0.76 |
Source: PIB/MoSPI, ASI 2024-25 results, 30 September 2026. Last column calculated for this article
It’s often said as India’s top factory state, Tamil Nadu is also its biggest manufacturing economy.
The record shows Tamil Nadu leads on the number of factories and workers, but Maharashtra and Gujarat each produce more manufacturing value added. In 2024-25 Tamil Nadu was third, with 10.90% of national factory GVA.
Why the gap matters
Output tells the same story as value added. In 2023-24 Gujarat produced 17.22% of India’s factory output and Maharashtra 14.47%, against Tamil Nadu’s 10.11%, even though Tamil Nadu employed more factory workers than either. Gujarat’s share of fixed capital, 19.53%, was well over double Tamil Nadu’s 8.09%.
Value added per worker sets the ceiling for factory wages. A state that employs many people at lower value added per head will, other things equal, pay lower average wages, even as it creates more jobs. That is the trade-off running through Tamil Nadu’s industrial strategy. The January 2024 Global Investors Meet listed ₹3,79,809 crore of industry MoUs, many in electronics and electric vehicles, sectors that could raise both capital and value added per worker if built.
Exports show the specialisation. The commerce ministry told the Lok Sabha in April 2025 that Tamil Nadu exported ₹25,069.92 crore of motor vehicles and ₹20,168.65 crore of auto components in 2023-24, first in India in both.
Tamil Nadu inside a growing national base
| ASI round | Factories, India | Persons engaged, India | GVA, India (₹ lakh crore) | TN factories (approx.) |
|---|---|---|---|---|
| 2022-23 | 2,53,334 | 1,84,94,962 | 21.97 | 39,700 |
| 2023-24 | 2,60,061 | 1,95,89,131 | 24.58 | 40,100 |
| 2024-25 | 2,66,931 | 2,09,96,913 | 26.94 | 41,221 |
Source: PIB/MoSPI ASI releases for 2022-23, 2023-24 and 2024-25. TN factories for 2022-23 and 2023-24 estimated for this article from published shares (15.66% and 15.43%), rounded to the nearest hundred
On those estimates, Tamil Nadu added roughly 1,500 registered factories in two years. Its share of factories hardly moved, which means the state grew at about the national pace in factory numbers rather than pulling ahead.
What this means for you
- Jobs and value are different scorecards; Tamil Nadu wins the first and is third on the second.
- If you work in a Chennai-area factory, ASI wage and emoluments tables (when released state-wise) are the benchmark for your industry.
- Investment announcements in capital-heavy sectors are the ones that would move the value-added share; track whether they reach production.
- One year’s rise in GVA share is a signal, not a trend; wait for the 2025-26 round.
What to watch
Pending
MoSPI’s detailed state tables for ASI 2024-25, with output, fixed capital, wages and industry-wise data for Tamil Nadu.
Pending
ASI 2025-26, the next round. Recent releases came in late August or late September.
Checked against official sources on 23 October 2026. Figures and rules change; confirm on the linked official pages before relying on them.
Sources
- Release of the Annual Survey of Industries (2024-25) results, 30.09.2026 (PIB, Ministry of Statistics and Programme Implementation)
- Annual Survey of Industries (ASI) Results for 2023-24, 27.08.2025 (PIB, MoSPI)
- Annual Survey of Industries (ASI) Results for 2022-23, 30.09.2024 (PIB, MoSPI)
- Lok Sabha Unstarred Question No. 5008, state-wise IT and automobile exports, 01.04.2025 (Ministry of Commerce and Industry)
- Press Release No. 051, Chief Minister’s address at GIM 2024 valedictory, 08.01.2024 (Government of Tamil Nadu)