The National Centre for Coastal Research has measured how every state’s shoreline moved between 1990 and 2018. Tamil Nadu comes out among the worst-eroding large coasts in India, and the state is now spending a World Bank-backed ₹1,675 crore on the problem. This is what the data shows and what it leaves out.
The numbers
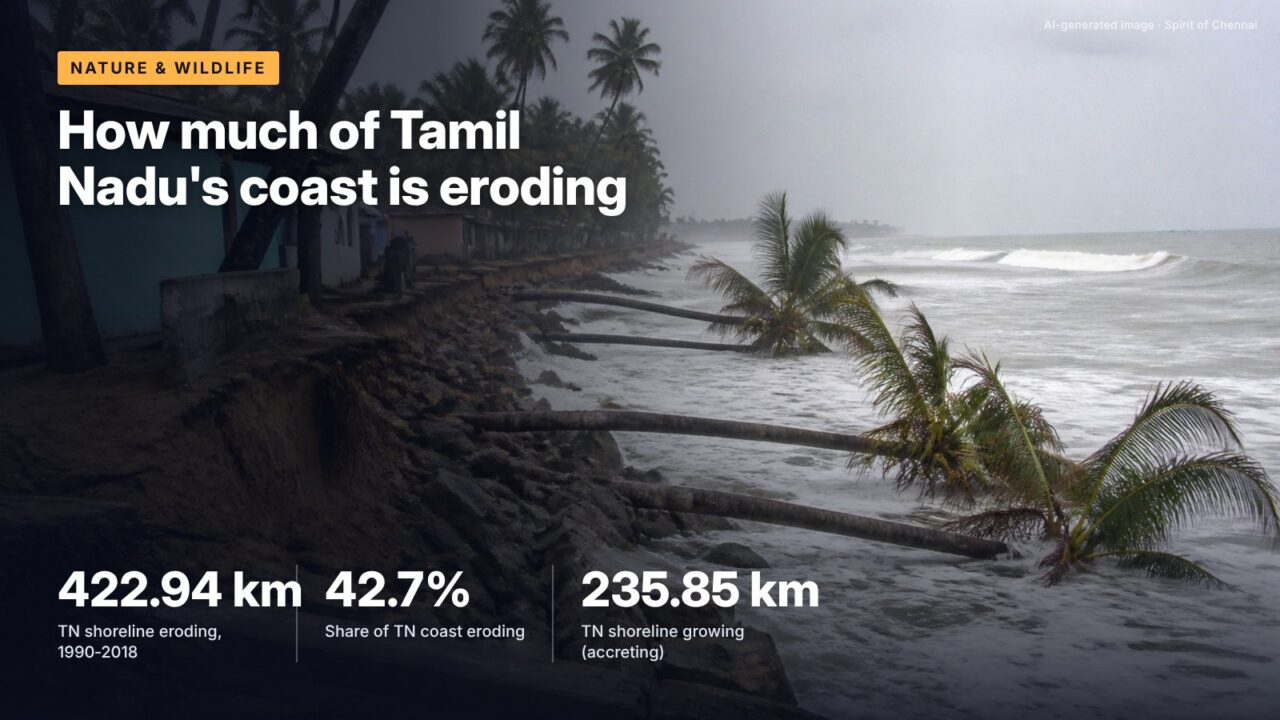
Of Tamil Nadu’s 991.47 km of shoreline as mapped by the National Centre for Coastal Research (NCCR), 422.94 km eroded between 1990 and 2018. That is 42.7 per cent, against a national figure of 33.6 per cent. The numbers come from the Ministry of Earth Sciences’ answer to Rajya Sabha question 517 of 7 December 2023, and they were repeated unchanged in a Lok Sabha answer of 3 February 2025.
The same table shows the other side. Another 332.69 km, a third of the coast, was stable, and 235.85 km, nearly a quarter, grew seaward as sand built up. Subtracting the accreting stretch from the eroding one leaves about 187 km more of the coast losing ground than gaining it. For Chennai readers that balance matters: erosion on one side of a structure often comes with build-up on the other.
How the measurement was done
NCCR, a Chennai-based institute of the Ministry of Earth Sciences, used 28 years of satellite images and field surveys to map the shoreline and classify the causes of change as natural or human-made, the ministry said in a Lok Sabha answer of 9 February 2022. Each stretch is labelled eroding, stable or accreting according to how its position moved over the period. The method answers where the coast has moved, not how much land was lost, and none of the answers give a figure in hectares.
Why the coastline figures differ
Two cautions apply. The 2022 answer says NCCR mapped a 6,632 km shoreline, while the state-wise table adds up to 6,907.18 km; the documents do not reconcile the two. And Tamil Nadu’s 991.47 km is shorter than the 1,076 km the state usually gives for its coastline, a figure repeated on the Tamil Nadu Green Climate Company’s mission page. The two come from different measurements, so percentages should be compared only within the NCCR table.
How Tamil Nadu compares
| State or UT | Shoreline (km) | Eroding (km) | Eroding (%) | Accreting (km) |
|---|---|---|---|---|
| West Bengal | 534.35 | 323.07 | 60.5 | 134.88 |
| Puducherry | 41.66 | 23.42 | 56.2 | 4.42 |
| Kerala | 592.96 | 275.33 | 46.4 | 134.99 |
| Tamil Nadu | 991.47 | 422.94 | 42.7 | 235.85 |
| Andhra Pradesh | 1,027.58 | 294.89 | 28.7 | 509.33 |
| Gujarat | 1,945.60 | 537.50 | 27.6 | 377.20 |
| Odisha | 549.50 | 140.72 | 25.6 | 280.02 |
| Maharashtra | 739.57 | 188.26 | 25.5 | 73.62 |
| India | 6,907.18 | 2,318.31 | 33.6 | 1,855.03 |
Source: Ministry of Earth Sciences, Rajya Sabha Unstarred Question 517, 7 December 2023, NCCR shoreline change 1990-2018
Measured in kilometres, only Gujarat, with nearly twice the coastline, has more eroding shore than Tamil Nadu. In percentage terms, West Bengal, Puducherry and Kerala are worse. Andhra Pradesh and Odisha, by contrast, have more coast accreting than eroding.
Share of Puducherry’s 41.66 km shoreline that eroded between 1990 and 2018, the second-highest rate in the NCCR table; it lies at the end of the East Coast Road from Chennai.
The parliamentary answers stop at state level. They do not split Tamil Nadu by district, so the Chennai, Chengalpattu and Tiruvallur stretches cannot be isolated from these tables, and claims about how much of the city’s own beach is eroding need NCCR’s district maps rather than the state total.
Who pays for coastal protection
The Centre treats coastal protection as a state job. The 2025 answer says states plan and build the works using their own money, multilateral loans or central assistance, while the Union role is advisory, technical and catalytic. It also gave the scale of spending across the ten maritime states and union territories: ₹2,641.39 crore over the past ten years to protect 227.965 km, and ₹7,218.63 crore proposed or under way for 298.714 km over the next five.
Dividing each sum by its length gives about ₹11.6 crore per km for past works and about ₹24.2 crore per km for the coming ones. The answer does not explain the rise, and the figures are not split by state.
Tamil Nadu’s biggest current commitment is TN-SHORE, short for Tamil Nadu Sustainably Harnessing Ocean Resources and Blue Economy. The Green Climate Company page puts its cost at ₹1,675 crore, of which ₹1,172.5 crore is World Bank assistance and ₹502.5 crore the state’s share, with activities spread over 2025 to 2030. Its four components are coastal biodiversity, coastal protection, livelihoods and pollution abatement.
It sits inside the Tamil Nadu Coastal Restoration Mission, announced in 2021 as the state’s fourth climate mission and run by the Tamil Nadu Green Climate Company with the environment, forest and fisheries departments, and with NIOT and the State Integrated Coastal Management Society as technical partners. The mission lists mangrove planting, dune restoration, estuary desilting and bio-shields among its tools. Its online counters of hectares restored and people reached were showing zero when checked, so there is no official progress figure yet.
Hard walls and soft fixes
The answers set out the policy tools. The Coastal Regulation Zone Notification of 2019 permits erosion control works in CRZ areas. The Union environment ministry has told states to fold shoreline management plans into their Coastal Zone Management Plans, and has drawn a hazard line along the whole coast for disaster planning. NCCR demonstrated beach restoration at Puducherry, where a lost beach was brought back, and flood protection at Chellanam in Kerala.
Elsewhere the trend is towards softer options. Maharashtra’s ADB-supported programme, the 2025 answer notes, favours artificial reefs, beach nourishment and dune management over rock walls. TN-SHORE’s emphasis on mangroves and dunes points the same way, though its coastal protection component may still include structures; the published page does not list individual works.
It’s often said the sea is eating away the whole Tamil Nadu coast.
The record shows NCCR’s 1990-2018 assessment found 42.7 per cent eroding, 33.6 per cent stable and 23.8 per cent accreting. Erosion is the largest category, but more than half the coast was stable or growing.
What this means for you
- Before buying beachfront land on ECR or in north Chennai, ask the district administration or the State Coastal Zone Management Authority for the CRZ classification and the hazard line for that survey number.
- State-level erosion percentages say little about a single beach; NCCR’s shoreline maps are the right reference for a specific stretch.
- Rock groynes and sea walls are state works funded from the state budget or loans, so questions about a local wall go to the state, not the Centre.
- TN-SHORE runs to 2030; its community and mangrove work is meant to involve fisher associations and self-help groups along the coast.
What to watch
2025 to 2030
TN-SHORE’s funded activity window, with ₹1,172.5 crore of World Bank assistance.
Pending
Shoreline management plans to be included in Tamil Nadu’s Coastal Zone Management Plan, as the Union ministry has directed.
Pending
An updated NCCR assessment beyond 2018; the answers of 2022, 2023 and 2025 all used the same 1990-2018 table.
Checked against official sources on 23 October 2026. Figures and rules change; confirm on the linked official pages before relying on them.
Sources
- Rajya Sabha Unstarred Question 517, 7 December 2023, Ministry of Earth Sciences (shoreline change)
- Lok Sabha Unstarred Question 26, 3 February 2025, Ministry of Environment, Forest and Climate Change (coastal erosion)
- Lok Sabha Unstarred Question 1170, 9 February 2022, Ministry of Earth Sciences
- Tamil Nadu Coastal Restoration Mission, Tamil Nadu Green Climate Company
- TN SHORE (World Bank), Tamil Nadu Green Climate Company