Almost six of every ten tonnes that crossed Chennai Port’s quays in 2019-20 arrived or left packed in a steel box. Containers carried 26.71 million tonnes of the port’s 46.76 million that year, and oil carried most of the rest, according to the port’s Administration Report for 2019-20, the latest port-level split by commodity we could open on an official site.
The box has only grown since. In 2024-25, containers made up 35.09 million of the 54.96 million tonnes handled, or 64%, in the shipping ministry’s port sector update. And in 2025-26 the port set a record of 57.90 million tonnes, its ministry tables show.
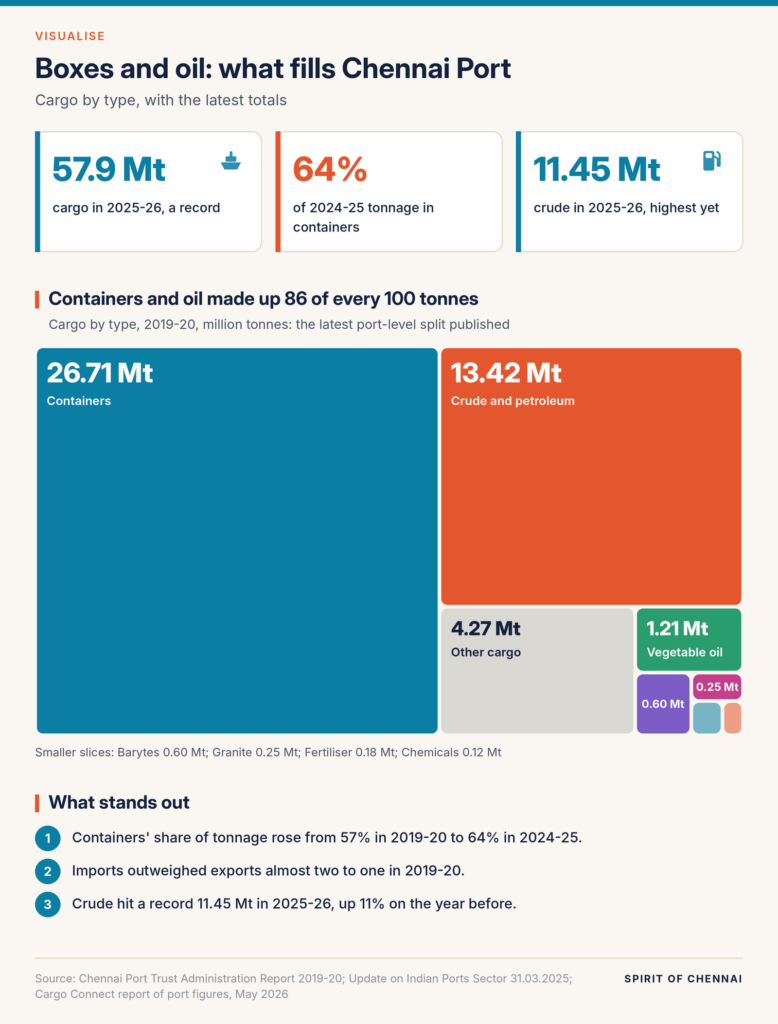
- Each rectangle’s area is that cargo’s share of the port’s total tonnage in 2019-20. Bigger box, more tonnes.
- Oil combines crude and petroleum products, imports and exports. “Others” is everything the report did not name, including cars and dry bulk.
- The three big numbers at the top are newer: 2024-25 and 2025-26.
Two cargoes do most of the work
In 2019-20, containerised cargo was 14.85 million tonnes of imports and 11.86 million tonnes of exports. Mineral oils and other petroleum products added 11.92 million tonnes of imports and 1.50 million of exports. Together, boxes and oil were 86 of every 100 tonnes.
The rest is a list of bulk goods with a Chennai story behind each: 1.21 million tonnes of vegetable oil coming in, about 0.60 million tonnes of barytes and 0.25 million tonnes of granite going out, and smaller amounts of fertiliser and chemicals. Imports outweighed exports almost two to one, at 30.44 million against 16.32 million tonnes.
Oil remains a large share. The port reported 11.45 million tonnes of crude in 2025-26, its highest ever and 11.17% more than a year earlier, Cargo Connect reported from the port’s year-end figures. It also shipped over two lakh cars.
Container cargo at Chennai Port in 2024-25, up from 30.68 million tonnes a year earlier, per the Basic Port Statistics 2024-25. That is 1.82 million TEUs.
Eleven years of tonnage, one dip
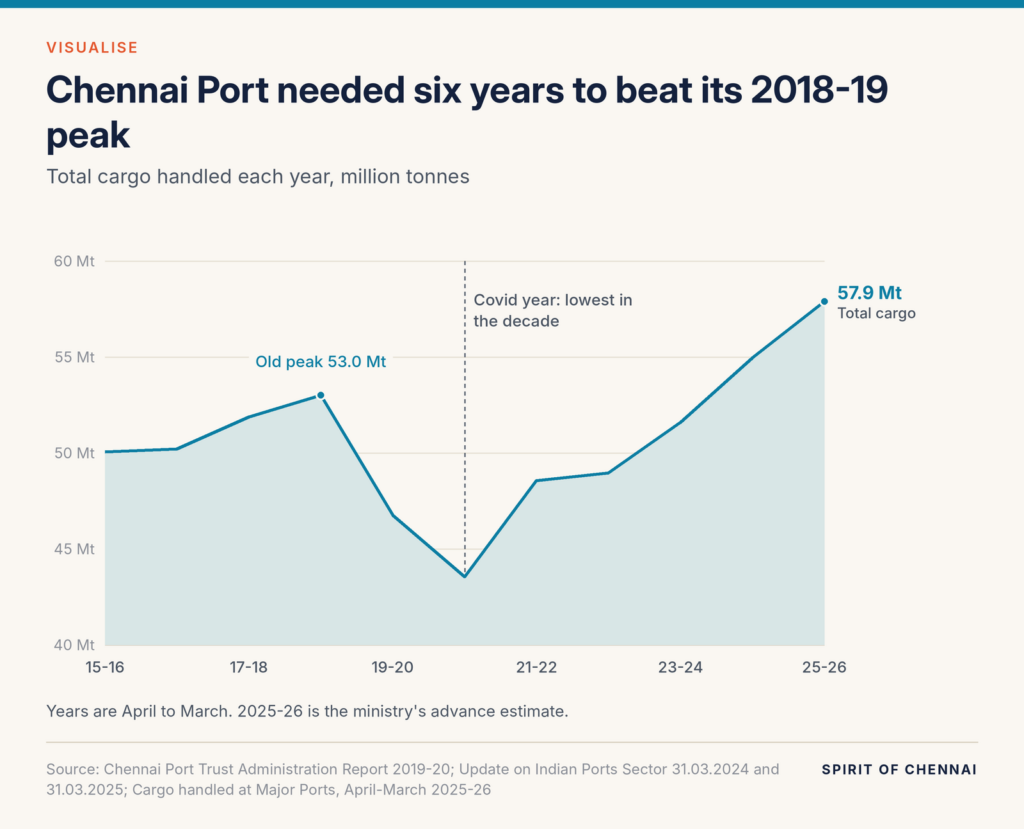
The port hovered around 50 million tonnes from 2015-16 to 2018-19, peaking at 53.01 million. Then it fell for two years, to 46.76 million in 2019-20 and 43.55 million in 2020-21, the Covid year. It recovered to 51.60 million in 2023-24 and finally passed the old peak in 2024-25, at 54.96 million. It has added tonnage every year since 2020-21.
Chennai against its Tamil Nadu neighbours
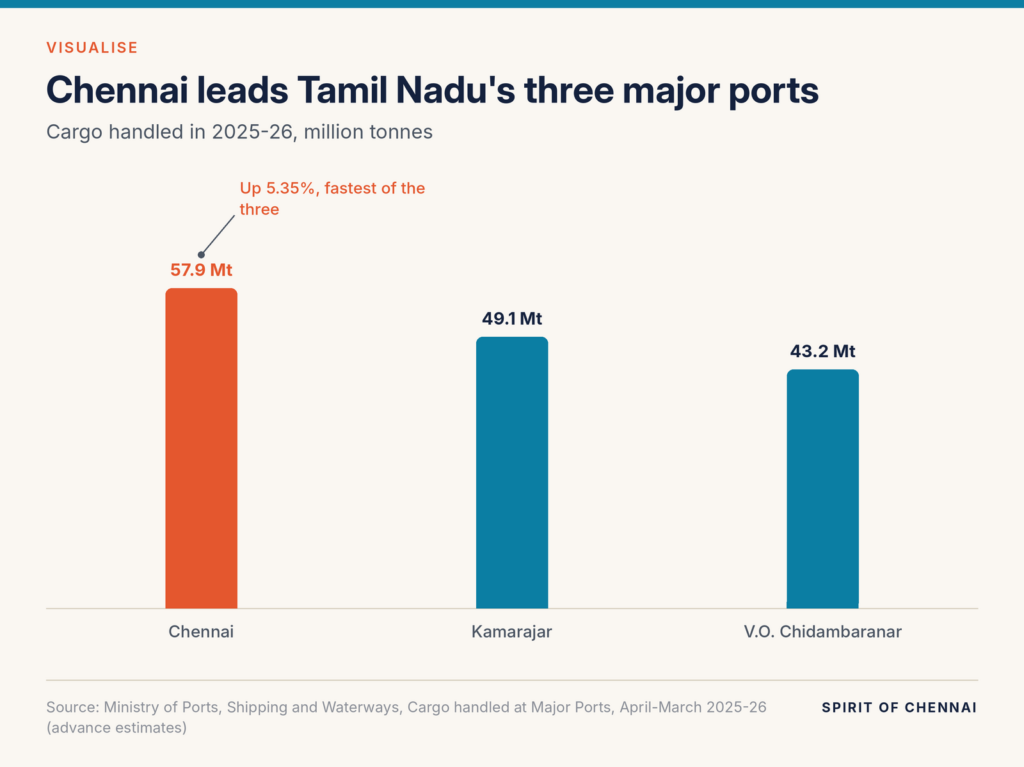
Tamil Nadu has three major ports. In 2025-26, Chennai handled 57.90 million tonnes, Kamarajar Port at Ennore 49.08 million and V.O. Chidambaranar at Thoothukudi 43.21 million, according to the ministry’s April-March table. Chennai also grew fastest of the three, by 5.35%, against 1.39% at Kamarajar and 3.56% at V.O. Chidambaranar.
The numbers behind the graphic
| Measure | Figure | Year |
|---|---|---|
| Containerised cargo (imports + exports) | 26.71 Mt (57.1%) | 2019-20 |
| Oil: mineral oils and other POL | 13.42 Mt (28.7%) | 2019-20 |
| Other cargo not named | 4.27 Mt (9.1%) | 2019-20 |
| Vegetable oils | 1.21 Mt (2.6%) | 2019-20 |
| Barytes / granite / fertiliser / chemicals | 0.60 / 0.25 / 0.18 / 0.12 Mt | 2019-20 |
| Total cargo, 2015-16 to 2019-20 | 50.06 / 50.21 / 51.88 / 53.01 / 46.76 Mt | Each year |
| Total cargo, 2020-21 to 2024-25 | 43.55 / 48.56 / 48.95 / 51.60 / 54.96 Mt | Each year |
| Total cargo | 57.90 Mt | 2025-26 |
| Containers | 35.09 Mt, 1.82 m TEUs | 2024-25 |
| Kamarajar / V.O. Chidambaranar | 49.08 / 43.21 Mt | 2025-26 |
Source: Chennai Port Trust Administration Report 2019-20 (commodity split and 2015-16 to 2019-20 totals); Update on Indian Ports Sector, 31.03.2024 and 31.03.2025 (2020-21 to 2024-25); Basic Port Statistics of India 2024-25 (containers); Cargo handled at Major Ports, April-March 2025-26 (2025-26). Shares calculated from tonnes.
About the data
The commodity treemap uses 2019-20 because that is the newest Chennai Port report with a commodity table we could read. The ministry’s monthly and annual tables give each port’s total but split commodities only for all major ports combined, and the port’s 2024-25 annual report on the ministry site is a scanned file without readable tables. Treat the treemap as the shape of the port’s trade, not this year’s exact mix.
Tonnage counts weight, so it undercounts light, valuable cargo such as cars. The 2025-26 crude, container and car figures come from the port’s year-end statement as reported by Cargo Connect, because the ministry tables do not split them by port.
Quick answers
What cargo does Chennai Port handle most?
Containers, followed by crude oil and petroleum products. Containers were 64% of tonnage in 2024-25.
How much cargo did Chennai Port handle in 2025-26?
57.90 million tonnes, a record and 5.35% more than 2024-25.
Is Chennai Port bigger than Kamarajar Port?
By tonnage, yes: 57.90 million tonnes against 49.08 million in 2025-26.
Information checked against official sources on 22 October 2026. Figures can be revised; confirm on the linked official pages before relying on them.
Sources
- Cargo handled at Major Ports, April-March 2025-26 (Ministry of Ports, Shipping and Waterways)
- Update on Indian Ports Sector up to 31.03.2025 (Ministry of Ports, Shipping and Waterways)
- Update on Indian Port Sector, 31.03.2024 (Ministry of Ports, Shipping and Waterways)
- Chennai Port Trust Administration Report 2019-20 (Ministry of Ports, Shipping and Waterways)
- Basic Port Statistics of India 2024-25 (Transport Research Wing, Ministry of Ports, Shipping and Waterways)
- Chennai Port achieves historic throughput of 57.9 million tonnes in FY 2025-26 (Cargo Connect, May 2026)