Krishnagiri, one of the least literate districts in Tamil Nadu in 2001, added 9.17 percentage points to its literacy rate by 2011, the biggest climb of any of the state’s 32 districts. Chennai, near the top, added 4.85 points, the third-smallest rise. Across the state, the districts that started furthest behind moved fastest between the two censuses.
The gap between the most and least literate districts shrank as a result. In 2001, Kanniyakumari (87.55%) was 27.24 points ahead of Dharmapuri (60.31%). By 2011 the same two districts were 23.21 points apart, at 91.75% and 68.54%. Census 2011 is still the latest completed count, so these are the newest district figures available.
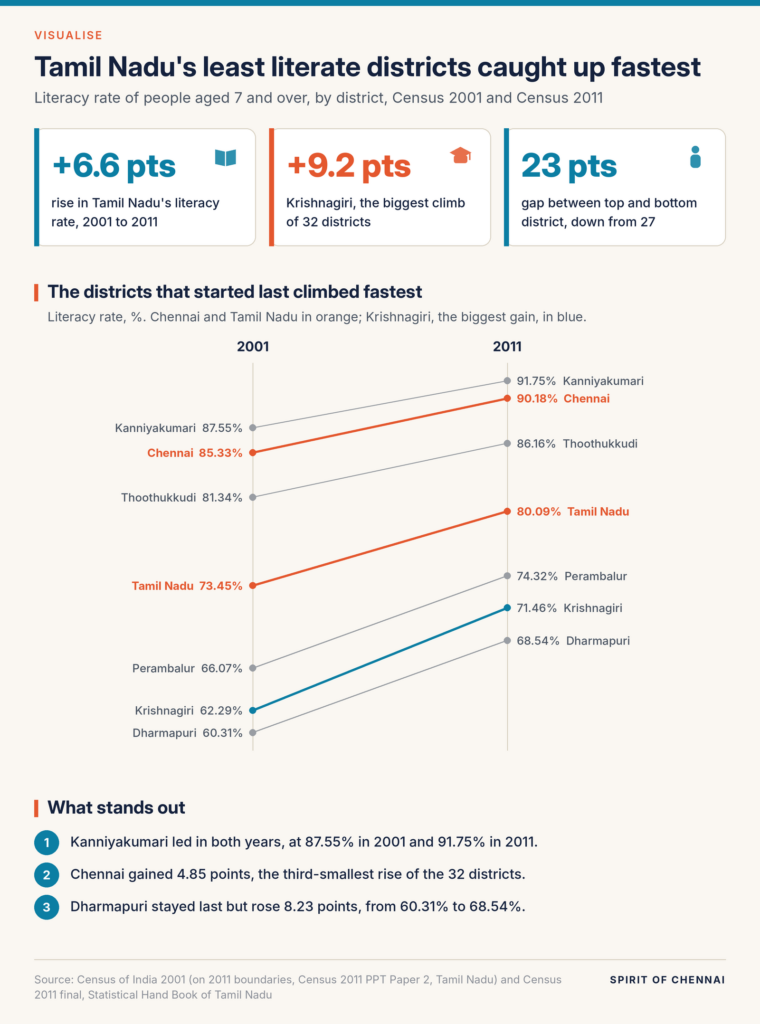
- Each line joins a district’s literacy rate in 2001 (left) to its rate in 2011 (right). A steeper line means a faster rise.
- Chennai and the Tamil Nadu average are in orange. Krishnagiri, the fastest riser, is in blue. The grey lines are the top three districts in 2011, plus Perambalur and Dharmapuri, two of the fastest risers.
- Literacy here means people aged seven and over who can read and write with understanding in any language.
The bottom of the table moved fastest
All four of the lowest-ranked districts in 2011 gained more than the state average of 6.64 points. Dharmapuri went from 60.31% to 68.54% (+8.23), Villupuram from 63.80% to 71.88% (+8.08) and Ariyalur from 64.08% to 71.34% (+7.26). Perambalur, just above them, gained 8.25 points. The top three moved least: Kanniyakumari +4.20, Thoothukkudi +4.82 and Chennai +4.85.
Part of that is arithmetic. A district already at 85% or 90% has less room left to grow than one at 60%. Even so, Dharmapuri was still last in 2011 and Kanniyakumari still first, in the final ranking in the state’s Statistical Hand Book.
Where women and men are furthest apart
The difference between men’s and women’s literacy shows the same north-west and central belt. In Ariyalur, 81.23% of men but only 61.74% of women could read and write in 2011, a gap of 19.49 points. Tiruvannamalai, Karur, Villupuram and Dharmapuri all had gaps above 17 points. Kanniyakumari’s gap was 3.75 points, about a fifth of Ariyalur’s, and Chennai’s was 7.06.
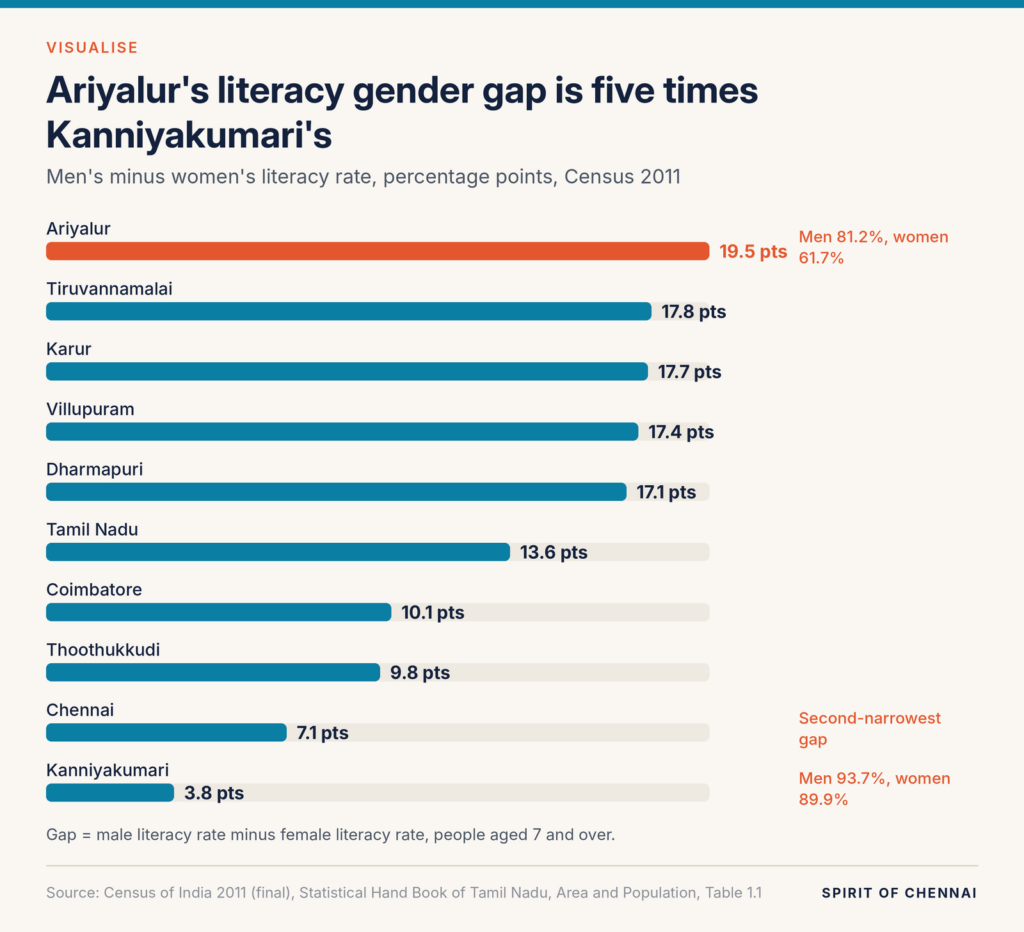
Rise in women’s literacy in Krishnagiri between 2001 and 2011, from 51.79% to 63.91%, the largest gain for women in the districts shown here, per the Census 2011 tables for Tamil Nadu and the state handbook.
Women gained more than men
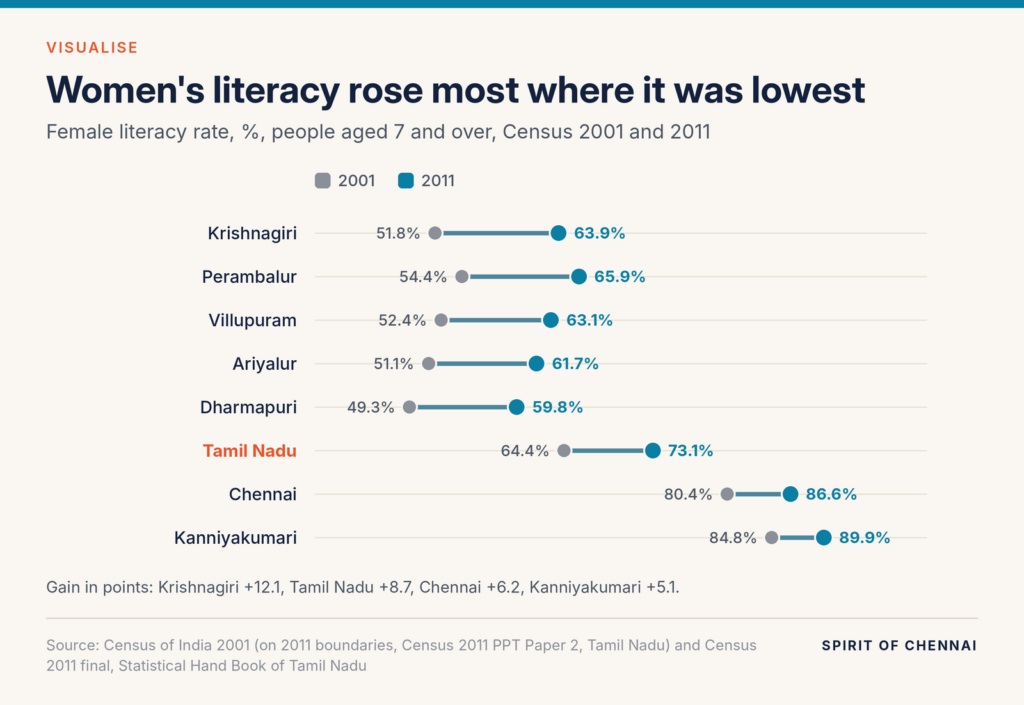
Across Tamil Nadu, women’s literacy rose 8.71 points over the decade, from 64.43% to 73.14%, while the overall rate rose 6.64 points. Women in the lowest-ranked districts gained more than ten points each: Krishnagiri +12.12, Perambalur +11.47, Villupuram +10.77, Ariyalur +10.59 and Dharmapuri +10.52. In Chennai the rise was 6.20 points and in Kanniyakumari 5.11, from much higher starting points.
The numbers behind the graphic
| District | All 2001 | All 2011 | Change | Men 2011 | Women 2001 | Women 2011 | Gap 2011 |
|---|---|---|---|---|---|---|---|
| Kanniyakumari | 87.55 | 91.75 | +4.20 | 93.65 | 84.79 | 89.90 | 3.75 |
| Chennai | 85.33 | 90.18 | +4.85 | 93.70 | 80.44 | 86.64 | 7.06 |
| Thoothukkudi | 81.34 | 86.16 | +4.82 | 91.14 | 74.89 | 81.33 | 9.81 |
| Coimbatore | 78.50 | 83.98 | +5.48 | 89.06 | 71.08 | 78.92 | 10.14 |
| Tamil Nadu | 73.45 | 80.09 | +6.64 | 86.77 | 64.43 | 73.14 | 13.63 |
| Karur | 68.08 | 75.60 | +7.52 | 84.54 | 56.76 | 66.86 | 17.68 |
| Tiruvannamalai | 67.39 | 74.21 | +6.82 | 83.11 | 55.63 | 65.32 | 17.79 |
| Perambalur | 66.07 | 74.32 | +8.25 | 82.87 | 54.43 | 65.90 | 16.97 |
| Ariyalur | 64.08 | 71.34 | +7.26 | 81.23 | 51.15 | 61.74 | 19.49 |
| Villupuram | 63.80 | 71.88 | +8.08 | 80.55 | 52.38 | 63.15 | 17.40 |
| Krishnagiri | 62.29 | 71.46 | +9.17 | 78.72 | 51.79 | 63.91 | 14.81 |
| Dharmapuri | 60.31 | 68.54 | +8.23 | 76.85 | 49.28 | 59.80 | 17.05 |
Source: 2001 rates from Census of India 2011, Provisional Population Totals Paper 2, Tamil Nadu (Directorate of Census Operations, 2011), which gives 2001 figures on 2011 district boundaries; 2011 rates are final Census 2011 figures from the Statistical Hand Book of Tamil Nadu, Area and Population, Table 1.1 (Department of Economics and Statistics). Literacy rate in % of people aged 7 and over. Change and gap (men minus women) are in percentage points, calculated.
About the data
The 2001 figures come from the Census 2011 provisional tables, which restate the 2001 count on the 32 districts that existed in 2011, so districts formed after 2001, such as Krishnagiri and Tiruppur, have a 2001 value. The 2011 figures are the final Census 2011 rates published by the Department of Economics and Statistics. Final and provisional 2011 rates differ slightly (Chennai is 90.33% provisional, 90.18% final), so we use the final numbers for 2011 throughout. The state’s 2001 rate is 73.45% in the census table and 73.47% in the handbook.
The same handbook gives the state’s 2011 female rate as 73.14% in one table and 73.44% in another; we use 73.14% from the district table. Tamil Nadu now has 38 districts, so these 32-district figures will not match today’s map, and the next census will replace them.
Quick answers
Which Tamil Nadu district had the highest literacy rate in 2011?
Kanniyakumari, at 91.75%, followed by Chennai at 90.18% and Thoothukkudi at 86.16%. Kanniyakumari was also first in 2001.
Which district had the lowest literacy rate?
Dharmapuri, at 68.54% in 2011, up from 60.31% in 2001.
How much did Tamil Nadu’s literacy rate rise between 2001 and 2011?
From 73.45% to 80.09%, a rise of 6.64 percentage points. Women’s literacy rose faster, from 64.43% to 73.14%.
Information checked against official sources on 22 October 2026. Figures can be revised; confirm on the linked official pages before relying on them.
Sources
- Census of India 2011, Provisional Population Totals Paper 2, Tamil Nadu (Directorate of Census Operations, Tamil Nadu)
- Statistical Hand Book of Tamil Nadu, Area and Population (Department of Economics and Statistics, Government of Tamil Nadu)
- Tamil Nadu at a Glance 2023-24 (Department of Economics and Statistics)