Ten of Tamil Nadu’s 38 districts drew 65% of the state’s 21.86 crore domestic tourist visits in 2022, the latest year with a district split. Tiruchirappalli topped the list with 2.04 crore visits, ahead of Ramanathapuram, Kanniyakumari and Madurai. Chennai was fifth, with 1.48 crore.
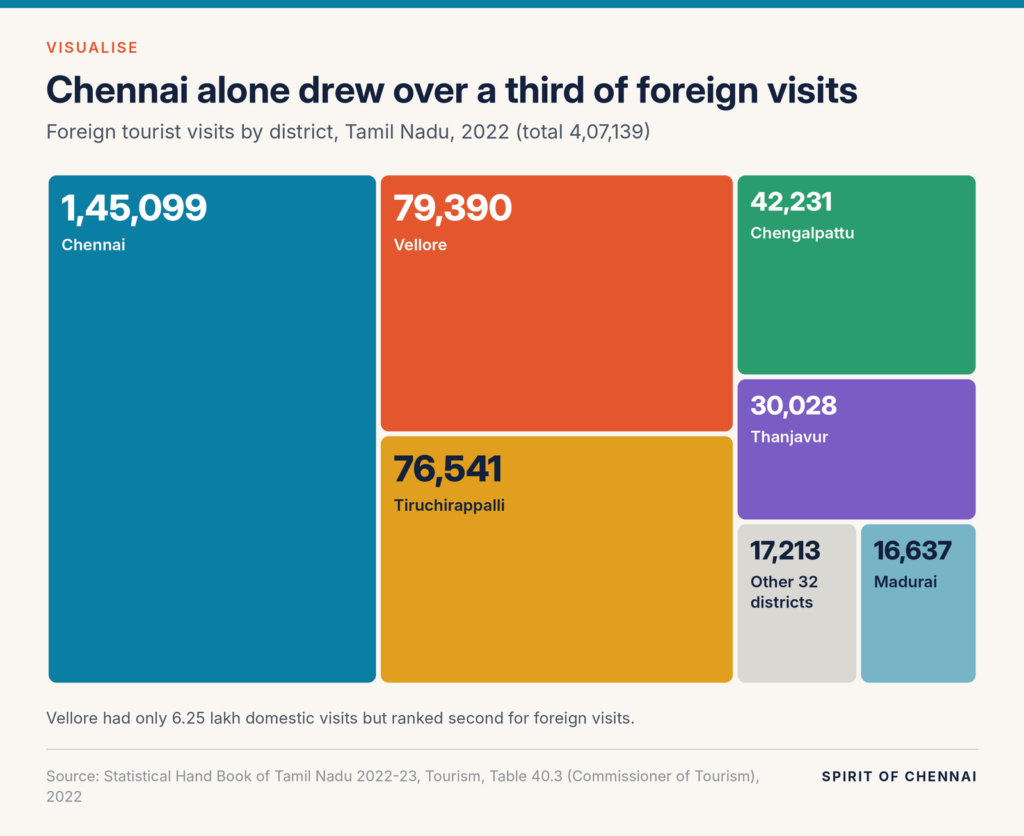
Foreign visitors were far more concentrated. Chennai alone received 1,45,099 of the 4,07,139 foreign visits counted in 2022, or 36%, according to the Statistical Hand Book of Tamil Nadu 2022-23. The tourism chapter takes its figures from the Commissioner of Tourism.
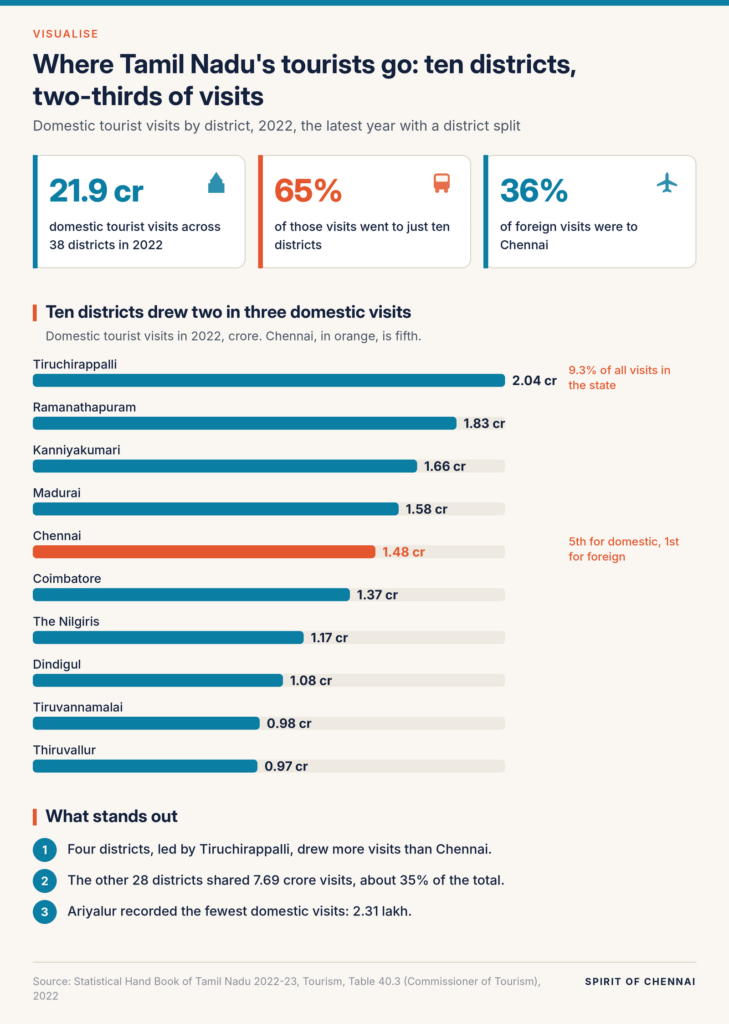
- Each bar is one district’s domestic tourist visits in 2022, in crore (one crore is ten million). Chennai is in orange.
- A visit is counted each time a tourist is recorded at a place, so one traveller touring three districts can count three times.
- The cards at the top give the state total and the two concentration figures behind the chart.
Temple towns and hill stations lead
The top of the list is a mix of pilgrim and holiday districts. Tiruchirappalli recorded 2,03,65,852 domestic visits, Ramanathapuram 1,83,35,979 and Kanniyakumari 1,66,29,482. Madurai followed with 1,58,39,414, ahead of Chennai’s 1,48,18,855. The Nilgiris, home to Udhagamandalam, was seventh with 1.17 crore and Dindigul, which includes Kodaikanal and Palani, eighth with 1.08 crore.
The other 28 districts shared the remaining 7.69 crore visits, about 35%. Ariyalur recorded the fewest, 2,31,416.
Foreign visitors cluster in a few places
Six districts took nearly 96% of foreign visits in 2022. After Chennai came Vellore (79,390) and Tiruchirappalli (76,541), then Chengalpattu, which includes Mamallapuram (42,231), Thanjavur (30,028) and Madurai (16,637). Vellore is the clearest outlier: it had only 6.25 lakh domestic visits, yet ranked second for foreign ones.
Foreign tourist visits to Tamil Nadu in all of 2021, under 1% of the 68.66 lakh recorded in 2019, according to the Ministry of Tourism’s reply in the Lok Sabha in March 2026.
Seventeen years of visits, and the Covid gap
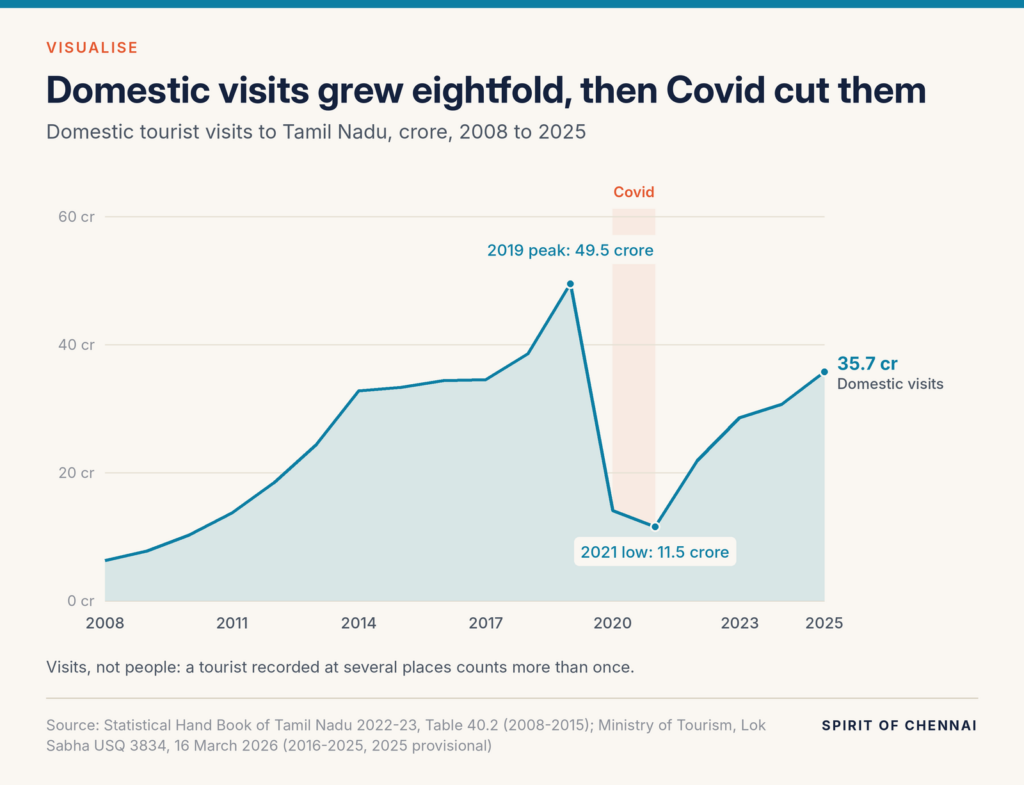
Domestic visits rose almost eightfold between 2008 and 2019, from 6.26 crore to 49.49 crore. Covid cut them to 14.07 crore in 2020 and 11.53 crore in 2021. Recovery has been steady but incomplete: the provisional figure for 2025 is 35.71 crore, about 72% of the 2019 peak. Foreign visits reached 15.46 lakh in 2025, still under a quarter of the 2019 level.
The numbers behind the graphic
| District (2022) | Domestic visits | Foreign visits | Share of domestic |
|---|---|---|---|
| Tiruchirappalli | 2,03,65,852 | 76,541 | 9.3% |
| Ramanathapuram | 1,83,35,979 | 293 | 8.4% |
| Kanniyakumari | 1,66,29,482 | 2,502 | 7.6% |
| Madurai | 1,58,39,414 | 16,637 | 7.2% |
| Chennai | 1,48,18,855 | 1,45,099 | 6.8% |
| Coimbatore | 1,36,66,295 | 1,718 | 6.3% |
| The Nilgiris | 1,16,68,218 | 666 | 5.3% |
| Dindigul | 1,07,81,568 | 35 | 4.9% |
| Tiruvannamalai | 98,04,571 | 1,221 | 4.5% |
| Thiruvallur | 97,44,541 | 1,413 | 4.5% |
| Vellore | 6,24,594 | 79,390 | 0.3% |
| Chengalpattu | 73,76,285 | 42,231 | 3.4% |
| Thanjavur | 62,54,107 | 30,028 | 2.9% |
| Tamil Nadu (38 districts) | 21,85,84,846 | 4,07,139 | 100% |
Source: Statistical Hand Book of Tamil Nadu 2022-23, Tourism, Table 40.3, district-wise tourist arrivals 2022 (Department of Economics and Statistics, from the Commissioner of Tourism). Shares calculated.
| Year | Domestic visits | Foreign visits |
|---|---|---|
| 2008 | 6,26,18,252 | 20,40,419 |
| 2009 | 7,80,37,607 | 23,69,050 |
| 2010 | 10,30,10,435 | 28,04,504 |
| 2011 | 13,67,50,750 | 33,08,438 |
| 2012 | 18,41,36,840 | 35,61,740 |
| 2013 | 24,42,32,487 | 39,90,490 |
| 2014 | 32,75,55,233 | 46,57,630 |
| 2015 | 33,34,59,047 | 46,84,707 |
| 2016 | 34,38,12,413 | 47,21,978 |
| 2017 | 34,50,61,140 | 48,60,455 |
| 2018 | 38,59,09,376 | 60,74,345 |
| 2019 | 49,48,65,257 | 68,66,327 |
| 2020 | 14,06,51,241 | 12,28,323 |
| 2021 | 11,53,36,719 | 57,622 |
| 2022 | 21,85,84,846 | 4,07,126 |
| 2023 | 28,60,11,515 | 11,74,899 |
| 2024 | 30,68,42,014 | 11,61,302 |
| 2025 (provisional) | 35,70,95,556 | 15,45,988 |
Source: 2008 to 2015 from Statistical Hand Book of Tamil Nadu 2022-23, Table 40.2; 2016 to 2025 from Ministry of Tourism, Lok Sabha Unstarred Question 3834, 16 March 2026. 2025 is provisional.
About the data
These are counts of tourist visits reported by the state’s tourism department, not of individual people, and they include pilgrims and day visitors recorded at monitored sites. The handbook and the ministry differ by a few visits in some years (2022 foreign visits are 4,07,139 in the handbook and 4,07,126 in the ministry reply), so the district chart uses the handbook and the yearly chart uses the ministry from 2016 onwards.
The 2022 table is the most recent district split in the handbook. It does not name individual sites, so the chart shows districts rather than single destinations. Tamil Nadu has 38 districts, all of which appear in the 2022 table.
Quick answers
Which district gets the most tourists in Tamil Nadu?
Tiruchirappalli, with 2.04 crore domestic visits in 2022. Chennai led for foreign visitors, with 1,45,099.
How many tourists visited Tamil Nadu in 2025?
The provisional count is 35.71 crore domestic visits and 15.46 lakh foreign visits.
Has tourism recovered to pre-Covid levels?
Not yet. Domestic visits in 2025 were about 72% of 2019’s 49.49 crore, and foreign visits about 23%.
Information checked against official sources on 22 October 2026. Figures can be revised; confirm on the linked official pages before relying on them.