


Line up 100 people from Chennai district as the 2011 Census counted it, and 90 of every 100 aged seven or over can read and write. That is ten points above the Tamil Nadu figure of 80.09%, and Chennai ranked second among the state’s districts on literacy, according to the Statistical Hand Book of Tamil Nadu.
The same line of 100 would hold almost exactly as many women as men, about 17 people from Scheduled Castes, fewer than one person from a Scheduled Tribe, and about nine children who had not yet turned seven. Census 2011 is still the latest completed count, so every picture below describes the city of 2011, not the city of 2026.
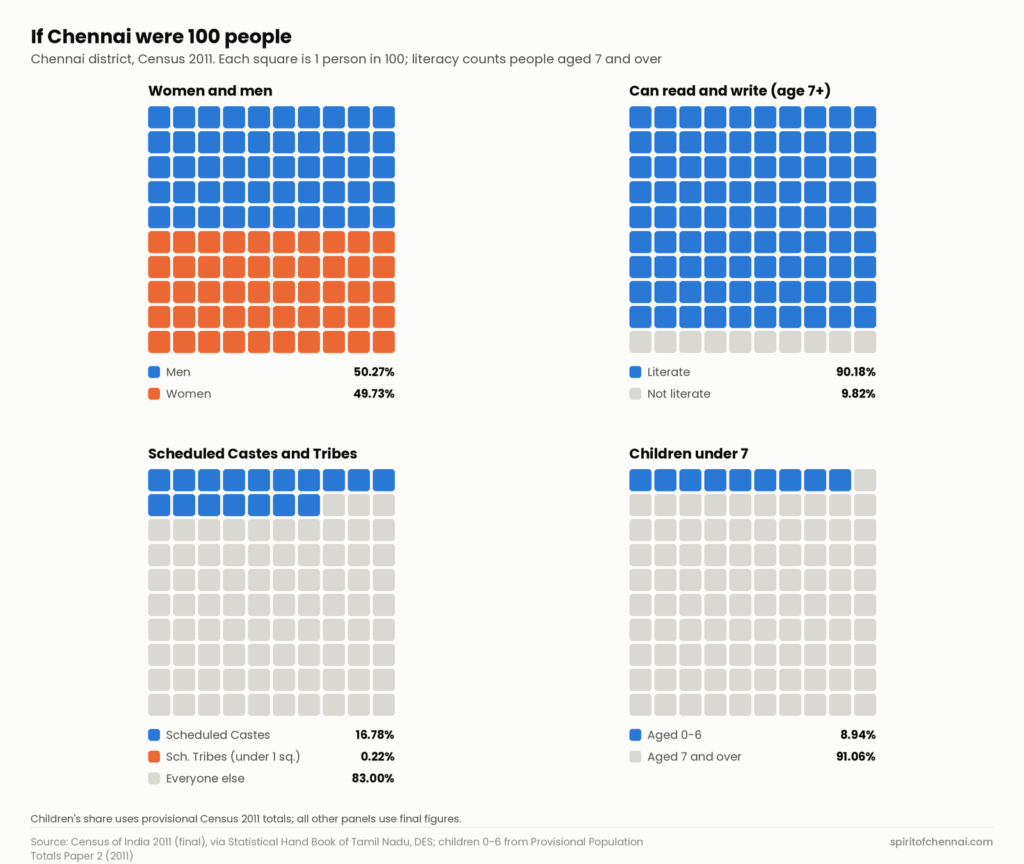
- Each grid has 100 squares, and each square stands for one person in 100. Grey squares are everyone else.
- Three grids count all residents. The literacy grid counts only people aged seven and over, because that is how the Census measures literacy.
- Shares are rounded to whole squares. The exact percentages are in the table further down.
A city split almost evenly between women and men
The final Census 2011 count put Chennai district at 46,46,732 people: 23,35,844 men and 23,10,888 women. That works out to 989 women per 1,000 men, close to the state ratio of 996. In a grid of 100, the split is 50 men and 50 women, with the women’s share just under half at 49.73%.
Children tell a slightly different story. The provisional Census totals published by the Directorate of Census Operations, Tamil Nadu counted 4,18,541 children aged 0 to 6 in Chennai, with 964 girls for every 1,000 boys. That child sex ratio was higher than the state’s 946. Children under seven made up 8.94% of Chennai’s provisional total, a little lower than the 9.56% share across Tamil Nadu.
Reading and writing: the gap that remains
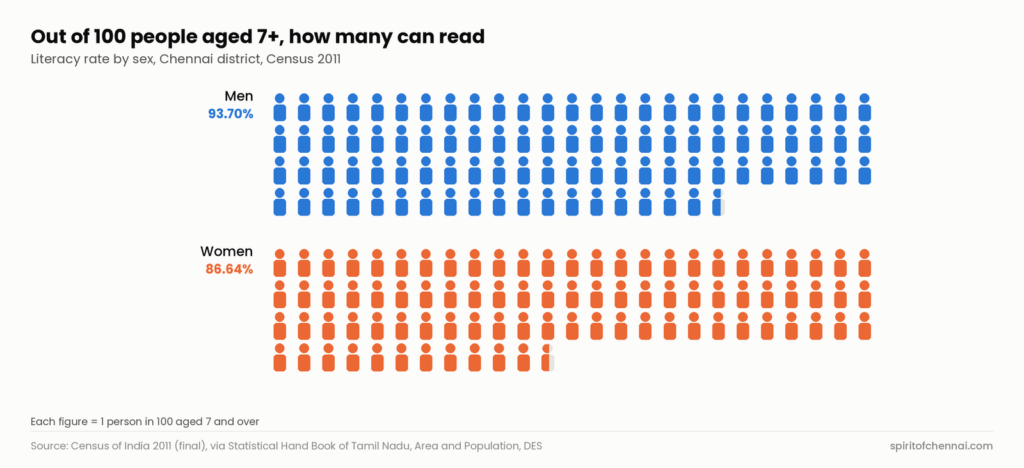
Chennai’s literacy rate was 90.18%, with men at 93.70% and women at 86.64%, in the final figures in the state handbook. So the city sits well ahead of the state, yet a seven-point gap between men and women was still there in 2011. Out of 100 women aged seven or over, roughly 13 could not read and write when the Census counted them.
People per square kilometre in Chennai district in 2011, on just 175 sq km, per the state statistical handbook. The district was the smallest by area and the most crowded in Tamil Nadu.
Scheduled Castes and Tribes, and how Chennai compares
The 2011 Census counted 7,79,667 people from Scheduled Castes in Chennai, or 16.78% of residents, and 10,061 people from Scheduled Tribes, or 0.22%. Both shares are lower than the state’s: Scheduled Castes were 20.01% of Tamil Nadu’s 7,21,47,030 people and Scheduled Tribes 1.10%. In a line of 100 Chennai residents, that is about 17 and fewer than one.
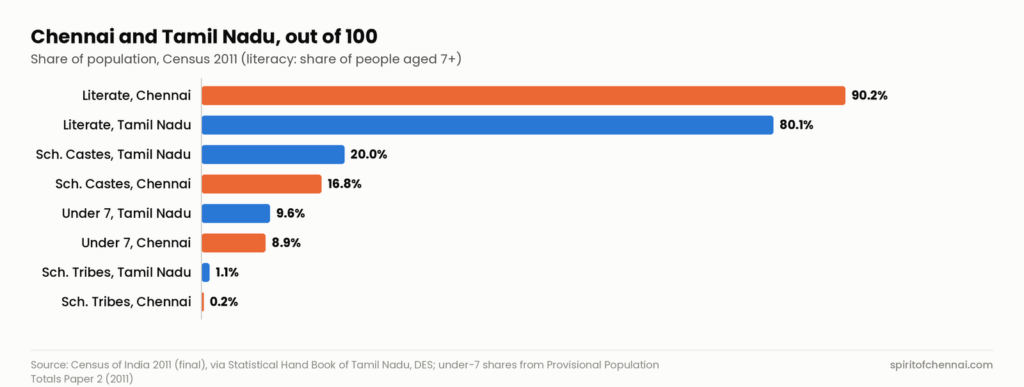
Set side by side, Chennai stands out on literacy and sits a little below the state on the other three measures. Chennai district was also fully urban in 2011, so every one of these 100 people was counted as a town dweller.
The numbers behind the graphic
| Measure | Chennai district | Tamil Nadu | Census 2011 status |
|---|---|---|---|
| Population | 46,46,732 | 7,21,47,030 | Final |
| Men / women | 23,35,844 / 23,10,888 | 3,61,37,975 / 3,60,09,055 | Final |
| Men / women, share of population | 50.27% / 49.73% | 50.09% / 49.91% | Final (calculated) |
| Women per 1,000 men | 989 | 996 | Final |
| Literacy rate, age 7+ (all / men / women) | 90.18% / 93.70% / 86.64% | 80.09% / 86.77% / 73.14% | Final |
| Scheduled Castes | 7,79,667 (16.78%) | 1,44,38,445 (20.01%) | Final |
| Scheduled Tribes | 10,061 (0.22%) | 7,94,697 (1.10%) | Final |
| Children aged 0-6 | 4,18,541 (8.94%) | 68,94,821 (9.56%) | Provisional |
| Girls per 1,000 boys, age 0-6 | 964 | 946 | Provisional |
Source: Census of India 2011, final figures as reproduced in the Statistical Hand Book of Tamil Nadu (Department of Economics and Statistics), Area and Population chapter; children aged 0-6 from Census 2011 Provisional Population Totals, Paper 2, Tamil Nadu (Directorate of Census Operations). Shares are calculated from the counts and rounded to two decimals.
About the data
All figures are from Census 2011. The population, sex ratio, literacy and Scheduled Caste and Tribe counts are final figures from the state handbook. The child count and child sex ratio are provisional, because the final age figures for the district were not available on the official pages we could open, so the children’s grid uses a slightly larger provisional total (46,81,087). The 2011 district covered the old 175 sq km city, not today’s 426 sq km Greater Chennai Corporation area.
Religion and the split of workers by type are also published for districts in the Census tables, but we could not open the Chennai tables on the Census website, so they are left out rather than estimated. The state’s Tamil Nadu at a Glance gives worker counts only at state level. Census 2027 will replace all of these numbers.
Quick answers
What is Chennai’s literacy rate in Census 2011?
90.18% for people aged seven and over: 93.70% for men and 86.64% for women, against 80.09% for Tamil Nadu.
What share of Chennai belongs to Scheduled Castes?
16.78% in 2011, or 7,79,667 people. Scheduled Tribes were 0.22%, or 10,061 people.
How many children under seven lived in Chennai in 2011?
4,18,541 in the provisional count, about 9 in every 100 residents, with 964 girls per 1,000 boys.
Information checked against official sources on 21 October 2026. Figures can be revised; confirm on the linked official pages before relying on them.
Sources
- Statistical Hand Book of Tamil Nadu, Area and Population (Department of Economics and Statistics, Government of Tamil Nadu)
- Census of India 2011, Provisional Population Totals Paper 2, Tamil Nadu (Directorate of Census Operations, Tamil Nadu)
- Tamil Nadu at a Glance 2023-24 (Department of Economics and Statistics)


