

One in every four road accidents in Tamil Nadu in 2024 happened in just three hours: between 6 pm and 9 pm. Police recorded 16,823 of the state’s 67,526 road accidents in that slot, 24.9%, according to the National Crime Records Bureau’s time-of-occurrence table. Across India the same slot accounted for 20.8%.
Chennai’s clock looks different. The city’s 3,762 crashes were spread almost evenly from 6 am to midnight, and a larger share happened in the small hours.
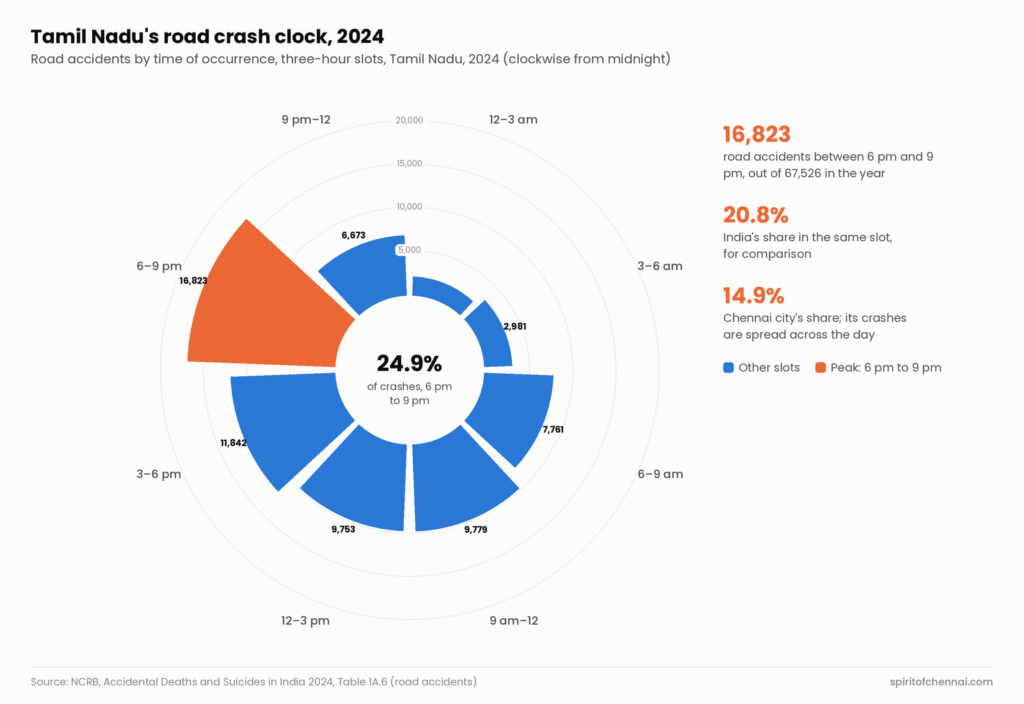
- The circle is a 24-hour clock cut into eight three-hour slots, starting at midnight at the top and running clockwise.
- The length of each bar is the number of road accidents recorded in that slot across Tamil Nadu in 2024. The orange bar is the 6 pm to 9 pm peak.
- The counts are crashes, not deaths.
The evening is the danger window
Crashes climb steadily through the day in Tamil Nadu, from 7,761 between 6 am and 9 am to 11,842 between 3 pm and 6 pm, then jump to 16,823 in the next three hours. Put together, the six hours from 3 pm to 9 pm account for 42.5% of the year’s road accidents. The peak coincides with the evening commute and the hours after sunset.
The quietest stretch is midnight to 3 am, with 1,914 accidents, 2.8% of the total. The nine hours from 9 pm to 6 am together hold 17.1%.
Chennai’s crash clock is flatter
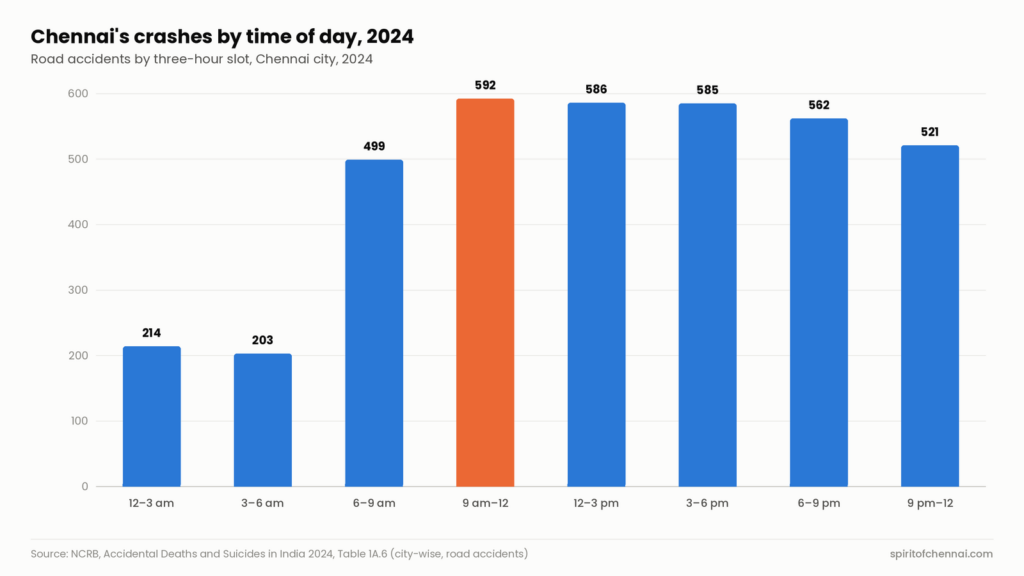
Inside the city, every three-hour slot from 6 am to midnight holds between 499 and 592 crashes. The busiest is 9 am to noon (592, 15.7%), and 6 pm to 9 pm is only fifth (562, 14.9%). Late nights matter more: the hours from 9 pm to 6 am hold 24.9% of Chennai’s crashes, and midnight to 3 am alone holds 5.7%, twice the state share.
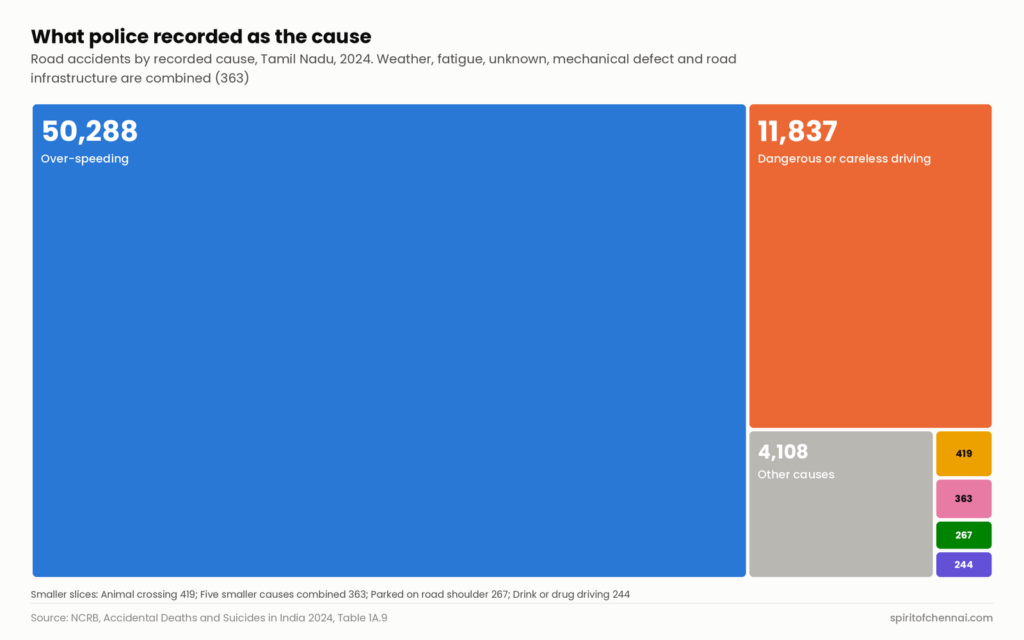
Share of Tamil Nadu’s 2024 road accidents that police attributed to over-speeding: 50,288 crashes, in which 13,765 people died (NCRB Table 1A.9).
Months matter less than speed
The calendar makes much less difference than the clock. Tamil Nadu’s monthly totals in the NCRB’s month-wise table ranged only from 5,221 in November to 5,963 in January. Chennai’s ran from 272 in February to 349 in August.
What police write down as the cause is far more lopsided. Over-speeding dominates, followed by dangerous or careless driving and overtaking (11,837 crashes, 3,040 deaths). Drunk or drugged driving is recorded in only 244 cases; that figure reflects only what was recorded as the main cause in police files.
The numbers behind the graphic
| Time of day | Tamil Nadu | Share | Chennai city | Share | All India | Share |
|---|---|---|---|---|---|---|
| Midnight to 3 am | 1,914 | 2.8% | 214 | 5.7% | 25,475 | 5.4% |
| 3 am to 6 am | 2,981 | 4.4% | 203 | 5.4% | 26,144 | 5.6% |
| 6 am to 9 am | 7,761 | 11.5% | 499 | 13.3% | 48,497 | 10.4% |
| 9 am to noon | 9,779 | 14.5% | 592 | 15.7% | 65,550 | 14.0% |
| Noon to 3 pm | 9,753 | 14.4% | 586 | 15.6% | 69,279 | 14.8% |
| 3 pm to 6 pm | 11,842 | 17.5% | 585 | 15.6% | 81,209 | 17.4% |
| 6 pm to 9 pm | 16,823 | 24.9% | 562 | 14.9% | 97,349 | 20.8% |
| 9 pm to midnight | 6,673 | 9.9% | 521 | 13.8% | 54,464 | 11.6% |
| Total | 67,526 | 100% | 3,762 | 100% | 4,67,967 | 100% |
Source: NCRB, Accidental Deaths and Suicides in India 2024, Table 1A.6 (road accidents section, State/UT-wise and city-wise). Shares calculated by Spirit of Chennai and rounded to one decimal place.
| Recorded cause, Tamil Nadu 2024 | Road accidents | Deaths |
|---|---|---|
| Over-speeding | 50,288 | 13,765 |
| Dangerous or careless driving, overtaking | 11,837 | 3,040 |
| Other causes | 4,108 | 1,068 |
| Animal crossing | 419 | 221 |
| Vehicles parked on road shoulders | 267 | 103 |
| Driving under influence of drugs or alcohol | 244 | 45 |
| Weather conditions | 105 | 51 |
| Driver fatigue | 90 | 46 |
| Cause not known | 85 | 74 |
| Mechanical defect in vehicle | 72 | 29 |
| Lack of road infrastructure | 11 | 7 |
| Total | 67,526 | 18,449 |
Source: NCRB, Accidental Deaths and Suicides in India 2024, Table 1A.9 (State/UT-wise). “Weather conditions” combines poor visibility (36 accidents) and other weather causes (69), as the table’s own total does.
About the data
The time, month and cause figures come from the NCRB’s Accidental Deaths and Suicides in India 2024, compiled from police records in each state. We used OpenCity’s reposts of the tables. The road ministry’s Road Accidents in India 2024 report has its own time-of-day table, but the readable version gives national figures only, so we used the NCRB’s state and city tables instead. Its Tamil Nadu total, 67,526 accidents and 18,449 deaths, matches the NCRB count exactly. The all-India column is the NCRB’s.
A bigger number in a time slot does not mean that hour is riskier per trip: the tables carry no traffic volumes. Time is when the crash was reported to have happened, and crashes never reported to the police are missing.
Quick answers
What time do most road accidents happen in Tamil Nadu?
Between 6 pm and 9 pm. In 2024 that slot had 16,823 road accidents, 24.9% of the state total.
What is the most common recorded cause?
Over-speeding, recorded for 50,288 of Tamil Nadu’s 67,526 road accidents in 2024.
Information checked against official sources on 21 October 2026. Figures can be revised; confirm on the linked official pages before relying on them.
Sources
- Accidental Deaths and Suicides in India 2024, Table 1A.6: Time of occurrence-wise number of traffic accidents, State/UT and city-wise (NCRB, via OpenCity)
- Accidental Deaths and Suicides in India 2024, Table 1A.5: Month of occurrence-wise number of traffic accidents (NCRB, via OpenCity)
- Accidental Deaths and Suicides in India 2024, Table 1A.9: Cause-wise distribution of road accidents (NCRB, via OpenCity)
- Accidental Deaths and Suicides in India 2024: dataset and table list (NCRB, via OpenCity)
- Road Accidents in India 2024 (Ministry of Road Transport and Highways, via OpenCity)


