

Tamil Nadu recorded 6.8 deaths for every 1,000 people in 2024, higher than India’s 6.4, according to the Sample Registration System (SRS) run by the Registrar General of India. On almost every other vital rate the state is far below the national figure: 11.6 births per 1,000 people against 18.3, and 11 infant deaths per 1,000 live births against 24.
The two facts belong together. A state with few births and long lives grows older, and an older population records more deaths per head even when health care is good. The graphics below set the latest SRS figures for Tamil Nadu beside India’s, and then follow infant deaths over 16 years.
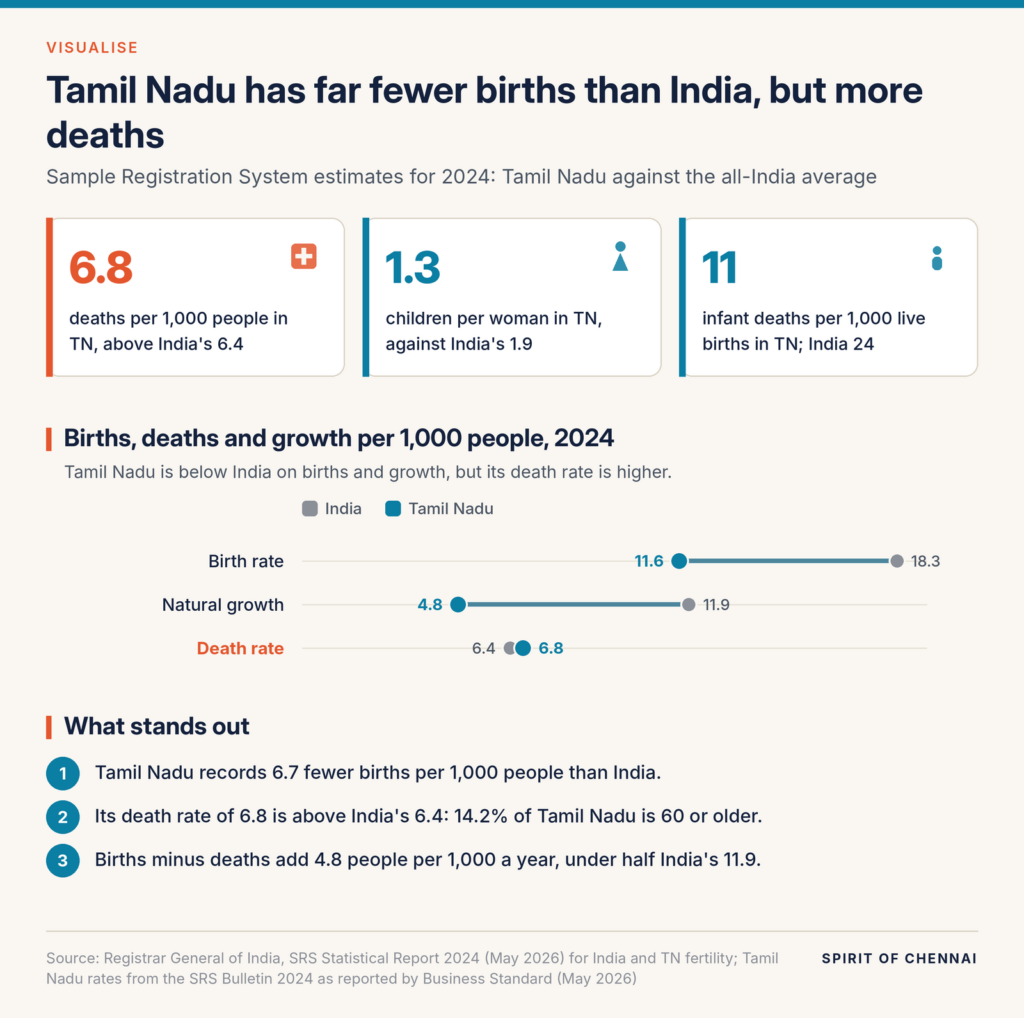
- In the dumbbell chart, the grey dot is India and the blue dot is Tamil Nadu. The longer the bar between them, the bigger the gap.
- All three rows use the same unit: events per 1,000 people in a year. Infant deaths and fertility use different units, so they sit in the cards above.
- Natural growth is births minus deaths, before anyone moves in or out.
Fewer births, and a higher death rate
India’s birth rate in 2024 was 18.3 per 1,000 people and its death rate 6.4, says the SRS Statistical Report 2024, published by the Registrar General in May 2026. Tamil Nadu’s figures, reported from the SRS bulletin by Business Standard, were 11.6 and 6.8. Of the states listed in that report, only Kerala, at 11.1, had a lower birth rate.
The same news report notes that 14.2% of Tamil Nadu’s people are 60 or older, the second-highest share in the country. That is why its death rate sits above India’s: more people are at the ages when deaths are common. Tamil Nadu’s natural growth rate is 4.8 per 1,000, against 11.9 for India.
Children per woman in Tamil Nadu in 2024, well below the replacement level of about two, against 1.9 for India, in the SRS Statistical Report 2024.
Infant deaths: more than halved since 2009
Tamil Nadu’s infant mortality rate was 28 per 1,000 live births in 2009, says the Statistical Hand Book of Tamil Nadu 2022-23, which reproduces the SRS series. By 2020 it was 13, by 2023 it was 12, Deccan Herald reported, and in 2024 it was 11. India’s rate fell from 50 to 24 over the same years.
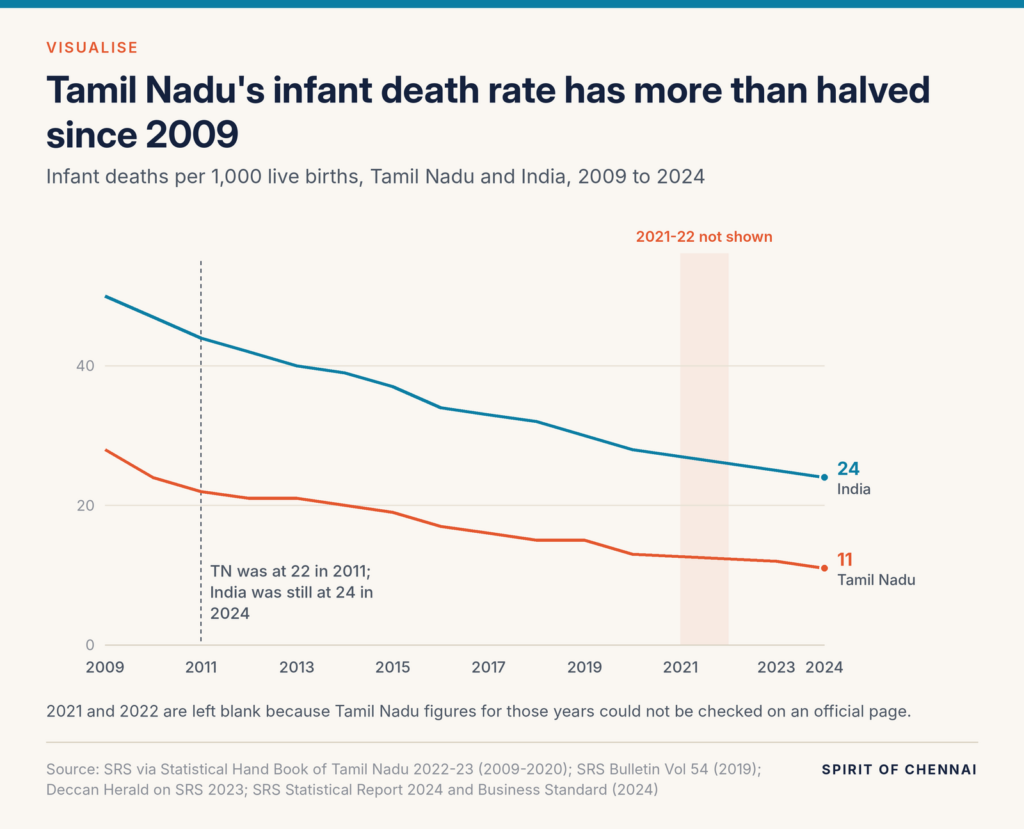
The gap between the two lines has narrowed in absolute terms, from 22 points to 13, but the lag is long. India’s 2024 rate of 24 is still above the 22 Tamil Nadu recorded in 2011. A Lok Sabha reply in 2019 gives the same Tamil Nadu and India figures for 2009 to 2017.
The numbers behind the graphic
| Measure, 2024 | Tamil Nadu | India |
|---|---|---|
| Birth rate (per 1,000 people) | 11.6 | 18.3 |
| Death rate (per 1,000 people) | 6.8 | 6.4 |
| Natural growth rate (per 1,000 people) | 4.8 | 11.9 |
| Infant mortality rate (per 1,000 live births) | 11 | 24 |
| Total fertility rate (children per woman) | 1.3 | 1.9 |
| Year | TN infant mortality rate | India infant mortality rate |
|---|---|---|
| 2009 | 28 | 50 |
| 2010 | 24 | 47 |
| 2011 | 22 | 44 |
| 2012 | 21 | 42 |
| 2013 | 21 | 40 |
| 2014 | 20 | 39 |
| 2015 | 19 | 37 |
| 2016 | 17 | 34 |
| 2017 | 16 | 33 |
| 2018 | 15 | 32 |
| 2019 | 15 | 30 |
| 2020 | 13 | 28 |
| 2023 | 12 | 25 |
| 2024 | 11 | 24 |
Source: Registrar General of India, SRS Statistical Report 2024 (India rates, TN fertility); SRS Bulletin 2024 as reported by Business Standard, May 2026 (TN birth, death, growth and infant rates); Statistical Hand Book of Tamil Nadu 2022-23 (infant mortality 2009 to 2018 and 2020); SRS Bulletin Vol 54 No 1, October 2021 (2019); Deccan Herald on SRS 2023 (2023). Rates per 1,000.
About the data
The SRS is a large continuous household survey, not a count of every birth and death, so its rates are estimates for each state. The 2024 statistical report is the latest edition. Its state tables could not be opened, so Tamil Nadu’s 2024 birth, death and infant rates are taken from a news report on the bulletin; India’s rates and both fertility rates come from the report itself.
Two gaps remain. Tamil Nadu figures for 2021 and 2022 are left out of the line chart because we could not check them on an official page, though India’s 2021 rate was 27, All India Radio reported. The state handbook’s 2019 row is out of line with the series, so 2019 uses the SRS bulletin instead: 15 for Tamil Nadu and 30 for India.
Quick answers
What is Tamil Nadu’s birth rate?
11.6 births per 1,000 people in 2024, against 18.3 for India, in the Sample Registration System.
Why is Tamil Nadu’s death rate higher than India’s?
Its population is older: 14.2% of people are 60 or above, so more deaths occur per 1,000 people.
What is Tamil Nadu’s infant mortality rate?
11 per 1,000 live births in 2024, less than half India’s 24.
Information checked against official sources on 22 October 2026. Figures can be revised; confirm on the linked official pages before relying on them.
Sources
- SRS Statistical Report 2024 (Office of the Registrar General of India, May 2026; copy hosted by OpenCity)
- SRS Statistical Report 2024, catalogue entry (Office of the Registrar General of India)
- Amid delimitation row, SRS bulletin reveals population imbalance in India (Business Standard, May 2026)
- Statistical Hand Book of Tamil Nadu 2022-23, Vital Statistics (Department of Economics and Statistics)
- SRS Bulletin, Volume 54 No 1, reference year 2019 (Office of the Registrar General of India)
- Lok Sabha Unstarred Question 3363, 12 July 2019 (Parliament of India)
- Infant mortality rate falls to 25 per 1,000 live births (Deccan Herald, September 2025)
- SRS 2021: India reports decline in maternal, infant and child mortality (All India Radio)


