Banks in Chennai held Rs 5,59,858 crore in deposits and had lent Rs 5,46,143 crore at the end of March 2023, according to the Tamil Nadu Statistical Hand Book. That single district accounted for about 46% of all bank deposits in the state, from roughly one in six of its bank offices.
Chennai’s banking numbers are lopsided in a way that says a lot about the state’s economy. Banks in Tamil Nadu lend more than they collect in deposits, one of the very few states where that is true, and much of that lending is booked or used in and around Chennai. Here is the official data.
Chennai’s deposits and credit, March 2023
The Institutional Finance chapter of the Statistical Hand Book 2022-23 gives district-wise data for scheduled commercial banks. It contains two Chennai tables built on different counts, and they do not match, so both are shown.
| Chennai, end March 2023 | Table 25.9 (bank offices) | Table 25.14 (branches) |
|---|---|---|
| Offices or branches | 1,926 | 1,858 |
| Deposits (Rs crore) | 5,59,858 | 4,95,461 |
| Credit (Rs crore) | 5,46,143 | 5,52,938 |
| Credit-deposit ratio | 97.6% | 111.6% |
The handbook does not explain the gap. A likely reason is that the tables use different reporting bases, one closer to where loans are sanctioned and the other to where they are used, and different bank coverage. What both agree on is the scale: Chennai’s banks hold around five lakh crore rupees in deposits and lend a similar amount. Of the 1,858 branches in Table 25.14, 1,803 are urban, 43 semi-urban and 12 rural.
Chennai against the state and other districts
| End March 2023 (Table 25.9) | Offices | Deposits (Rs crore) | Credit (Rs crore) | CD ratio |
|---|---|---|---|---|
| Chennai | 1,926 | 5,59,858 | 5,46,143 | 97.6% |
| Coimbatore | 929 | 1,00,815 | 1,01,191 | 100.4% |
| Madurai | 539 | 37,387 | 42,449 | 113.5% |
| Kancheepuram | 271 | 20,718 | 15,781 | 76.2% |
| Tamil Nadu | 12,091 | 12,11,394 | 12,80,195 | 105.7% |
By simple division of these figures, Chennai held about 46% of the state’s deposits and 43% of its bank credit, while Coimbatore, the next biggest, held about 8% of deposits. Chennai’s deposits were more than five times Coimbatore’s.
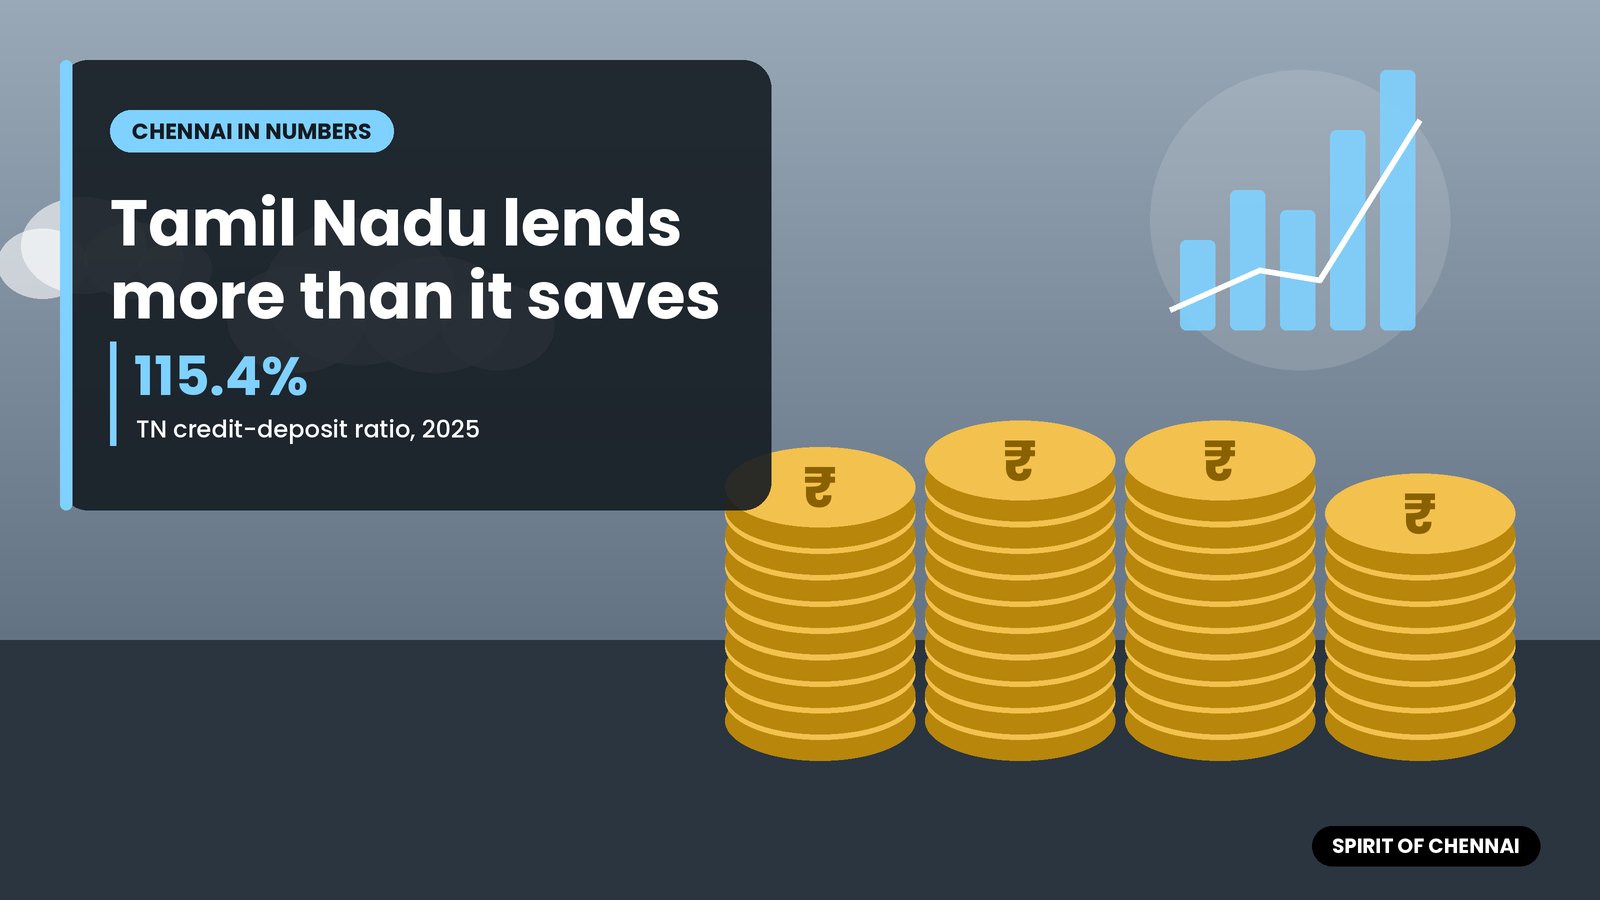
Tamil Nadu lends more than it saves
The credit-deposit (CD) ratio is loans divided by deposits. A ratio above 100% means banks are lending more in the state than they raise from it, drawing on funds from elsewhere. The Reserve Bank’s state handbook gives the ratio on two bases: where a loan is sanctioned, and where the money is actually used.
| End March | Tamil Nadu (place of sanction) | Tamil Nadu (place of use) | All India |
|---|---|---|---|
| 2023 | 105.8% | 109.4% | 75.8% |
| 2024 | 113.0% | 117.7% | 79.6% |
| 2025 | 115.4% | 120.5% | 80.1% |
Source: RBI Table 153 and Table 154, published December 2025. In March 2025, Tamil Nadu’s ratio by place of sanction was about 35 points above the national figure. The higher “place of use” ratio means some loans sanctioned by branches in other states are actually spent in Tamil Nadu, for example by companies whose bank accounts sit with a head office elsewhere but whose factories are here.
Chennai’s role as a headquarters city adds to its numbers. Indian Bank and Indian Overseas Bank are both head-quartered here, and large corporate borrowers based in the city have their loans booked at Chennai branches even when the money is used across the state.
Smaller districts tell a different story. Kancheepuram’s ratio of 76.2% means banks there collected far more in deposits than they lent locally, while Madurai, at 113.5%, lent more than it collected. Chennai sits in between on Table 25.9, but its absolute numbers dwarf every other district.
The national picture
Nationally, RBI’s population-group table shows scheduled commercial bank deposits growing about 11% and credit about 14% between March 2025 and March 2026, so the national CD ratio is still rising.
What this means for Chennai residents
- Branch density is high. Over 1,800 branches sat in a district of roughly 175 sq km (its 2011 population divided by the handbook’s density figure), so for most residents a branch is close by.
- High CD ratios cut both ways. They show credit flowing into the state’s economy, but also that local savings alone do not fund it.
- Complaints: for problems with a bank, use its grievance channel first, then the RBI’s integrated ombudsman scheme at cms.rbi.org.in.
This is general information, not financial advice; consult a qualified adviser for decisions about loans or deposits.
Quick answers
How much money is deposited in Chennai’s banks?
About Rs 5.6 lakh crore at the end of March 2023, per Table 25.9 of the state statistical handbook (Rs 4.95 lakh crore in Table 25.14).
What is Tamil Nadu’s credit-deposit ratio?
115.4% by place of sanction and 120.5% by place of use at end March 2025, per RBI, against 80.1% for India.
How many bank branches does Chennai have?
1,858 to 1,926 in March 2023, depending on the handbook table.
What share of Tamil Nadu’s bank deposits is in Chennai?
About 46% in March 2023, by simple division of the handbook’s figures.
Information checked against official sources on 18 October 2026. Fees, dates and rules can change; confirm on the linked official pages before acting.
Sources
- Statistical Hand Book of Tamil Nadu 2022-23, Chapter 25: Institutional Finance (Department of Economics and Statistics)
- Handbook of Statistics on Indian States, Table 153: State-wise Credit-Deposit Ratio, Place of Sanction (Reserve Bank of India, December 2025)
- Handbook of Statistics on Indian States, Table 154: State-wise Credit-Deposit Ratio, Place of Utilisation (Reserve Bank of India, December 2025)
- Handbook of Statistics on Indian Economy, Table 47: Deposits and Credit of SCBs by Population Group (Reserve Bank of India, July 2026)