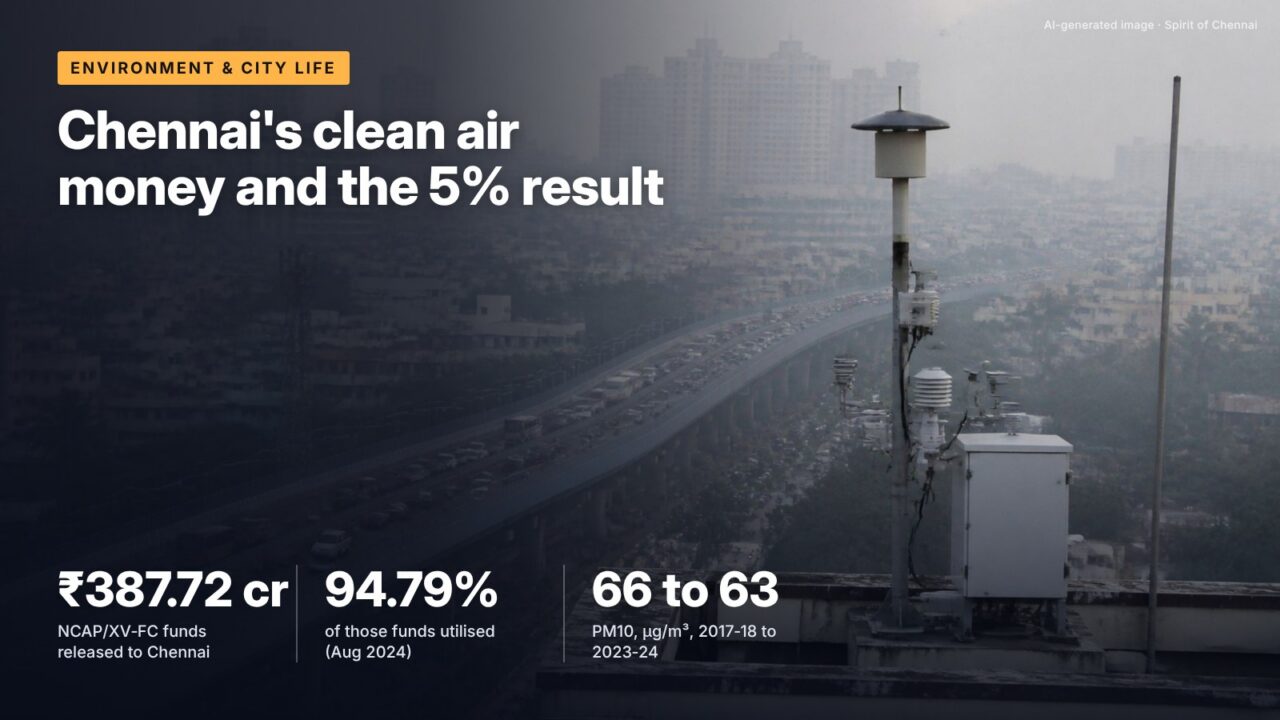
Chennai has received ₹387.72 crore under India’s clean air programme and spent almost all of it, yet its official PM10 level fell only from 66 to 63 micrograms between 2017-18 and 2023-24. The programme’s own numbers show why money and air quality have moved at different speeds.
The numbers
Chennai’s annual average PM10, the coarser of the two particle measures, was 66 micrograms per cubic metre (µg/m³) in 2017-18 and 63 µg/m³ in 2023-24, a 5% fall, according to the annexure to a Lok Sabha answer of 2 December 2024. The National Clean Air Programme (NCAP) set a goal of up to 40% reduction by 2025-26 against the 2017 base. For Chennai, 40% off 66 would mean about 40 µg/m³ (66 × 0.6).
Spending has been far quicker. The environment ministry told the Lok Sabha on 5 August 2024 that ₹387.72 crore had been released for the Chennai urban agglomeration and 94.79% utilised. Across all 131 NCAP cities, utilisation was 66% on 31 March 2024. Chennai is one of the programme’s better spenders and one of its slower improvers.
How NCAP money reaches Chennai
NCAP was launched to cover cities that did not meet national air quality standards over several years, called non-attainment cities. Tamil Nadu has four: Chennai, Madurai, Tiruchirappalli and Thoothukudi, according to a Central Pollution Control Board status report to the National Green Tribunal in December 2021. Each prepared a city clean air action plan covering vehicles, road dust, waste and crop burning, construction and industry.
Big cities like Chennai are funded mainly through Fifteenth Finance Commission grants for million-plus urban agglomerations, tied to air quality performance, rather than the smaller NCAP scheme budget. The CPCB report noted ₹233 crore released in 2020-21 for Chennai, Madurai and Trichy together under the Finance Commission window, against ₹3.06 crore under NCAP proper for Tamil Nadu’s plans in 2019-21. Nationally, ₹19,614.44 crore is earmarked for 2019-20 to 2025-26 and ₹11,211.13 crore had been released by mid-2024.
NCAP and Finance Commission air quality money released to 131 cities by mid-2024, out of ₹19,614.44 crore earmarked to 2025-26, the environment ministry told Parliament.
What the numbers show for Tamil Nadu
| City | PM10 2017-18 (µg/m³) | PM10 2023-24 (µg/m³) | Change |
|---|---|---|---|
| Thoothukudi | 123 | 57 | −54% |
| Tiruchirappalli | 88 | 47 | −47% |
| Madurai | 72 | 68 | −6% |
| Chennai | 66 | 63 | −5% |
Source: Lok Sabha Unstarred Question 1077, 2 December 2024, Annexure I; also PIB annexure of PM10 in 130 cities
Chennai began from the lowest base of the four, partly because a coastal city benefits from sea breezes that disperse pollution for much of the year. That makes large percentage cuts harder, but it does not explain why the national standard of 60 µg/m³ for annual PM10 was still not met in 2023-24. Only 18 of the 130 cities assessed met that standard in 2023-24; 97 showed some reduction and 55 cut PM10 by 20% or more, the same PIB-published annexure shows.
Fine particles tell a different story. The environment ministry gave Chennai’s 2023 annual PM2.5 average as 28 µg/m³ in a July 2024 Lok Sabha answer, below the national standard of 40 µg/m³. NCAP targets are tracked mainly on PM10, which is dominated in Indian cities by road and construction dust.
It’s often said Chennai’s air already meets national standards, so the programme matters less here.
The record shows Chennai met the PM2.5 standard in 2023 (28 against 40 µg/m³) but its PM10 average of 63 µg/m³ in 2023-24 was still above the annual standard of 60, which is why it stays a non-attainment city.
Why spending has outpaced results
Three features of the programme help explain the gap. First, a large share of city NCAP spending nationally has gone to road dust measures such as mechanical sweepers, paving and greening, which take time to show in annual averages. Second, PM10 averages swing year to year with weather, so a single year-on-base comparison can understate or overstate progress. Third, the CPCB’s 2021 report said micro-level action plans for Tamil Nadu’s non-attainment cities were still being finalised then and source apportionment studies were incomplete outside Bengaluru. Without a source study, cities cannot be sure which sector to target first.
The data published to Parliament gives only two points, the 2017-18 base and 2023-24, so it is not possible from these documents to say whether Chennai’s PM10 rose and fell in between. Station-level readings from the city’s continuous monitors are published on the CPCB portal, not in these answers.
How Chennai compares nationally
Nationally, 97 of 130 cities showed some fall in PM10 between 2017-18 and 2023-24 and 55 managed 20% or more. Chennai’s 5% puts it among the cities that improved, but outside that group of 55. On spending it does better than most: the August 2024 answer put utilisation among metro cities at 69.81% of ₹4,890.49 crore released, against Chennai’s 94.79%.
The ministry also ranks NCAP cities each year in the Swachh Vayu Sarvekshan, in three population groups, with 47 cities in the group above 10 lakh people. The July 2024 answer gave Delhi’s rank (ninth) but not Chennai’s, so the city’s position in that ranking is not part of this record.
Where Chennai stands on the target
| Measure | Chennai | Standard or goal |
|---|---|---|
| PM10, 2017-18 | 66 µg/m³ | 60 µg/m³ annual standard |
| PM10, 2023-24 | 63 µg/m³ | 60 µg/m³ annual standard |
| NCAP goal by 2025-26 | about 40 µg/m³ | up to 40% below base |
| PM2.5, 2023 | 28 µg/m³ | 40 µg/m³ annual standard |
Source: Lok Sabha answers of 22 July 2024 (USQ 20) and 2 December 2024 (USQ 1077); goal computed as 66 × 0.6
What this means for you
- Construction sites and unpaved road shoulders are the main local sources of PM10; complaints about uncovered debris go to the Corporation and TNPCB.
- Chennai’s fine-particle levels are lower than its coarse-dust levels, so dust control is where city action counts most.
- Annual averages hide seasonal spikes such as Bhogi and Deepavali; check daily readings before outdoor exercise on those days.
- Public money is tied to measured improvement under the Finance Commission window, so the city’s PM10 figure has budget consequences.
What to watch
Pending
PM10 results for 2025-26, the programme’s target year, which ended on 31 March 2026, will show how far Chennai got against the 40% goal.
Pending
A decision on NCAP’s shape after 2025-26, when the current funding window closes.
Checked against official sources on 23 October 2026. Figures and rules change; confirm on the linked official pages before relying on them.
Sources
- Lok Sabha Unstarred Question 1077, Multi-sectoral Intervention in NCAP, 2 December 2024
- Annexure I: PM10 concentrations of 130 cities, FY 2023-24 vs FY 2017-18, PIB, November 2024
- Lok Sabha Unstarred Question 2131, Utilization of Funds, 5 August 2024
- Lok Sabha Unstarred Question 20, Deaths linked to Pollution, 22 July 2024
- CPCB status report in O.A. 159 of 2021 (SZ), National Green Tribunal, December 2021