Tamil Nadu’s debt rose from 17 per cent of its economy in 2015 to 32 per cent in 2022, faster than the average state. RBI’s State Finances series and the 2026-27 budget show where it stands now, what is driving it, and the liabilities that sit outside the headline figure.
The numbers
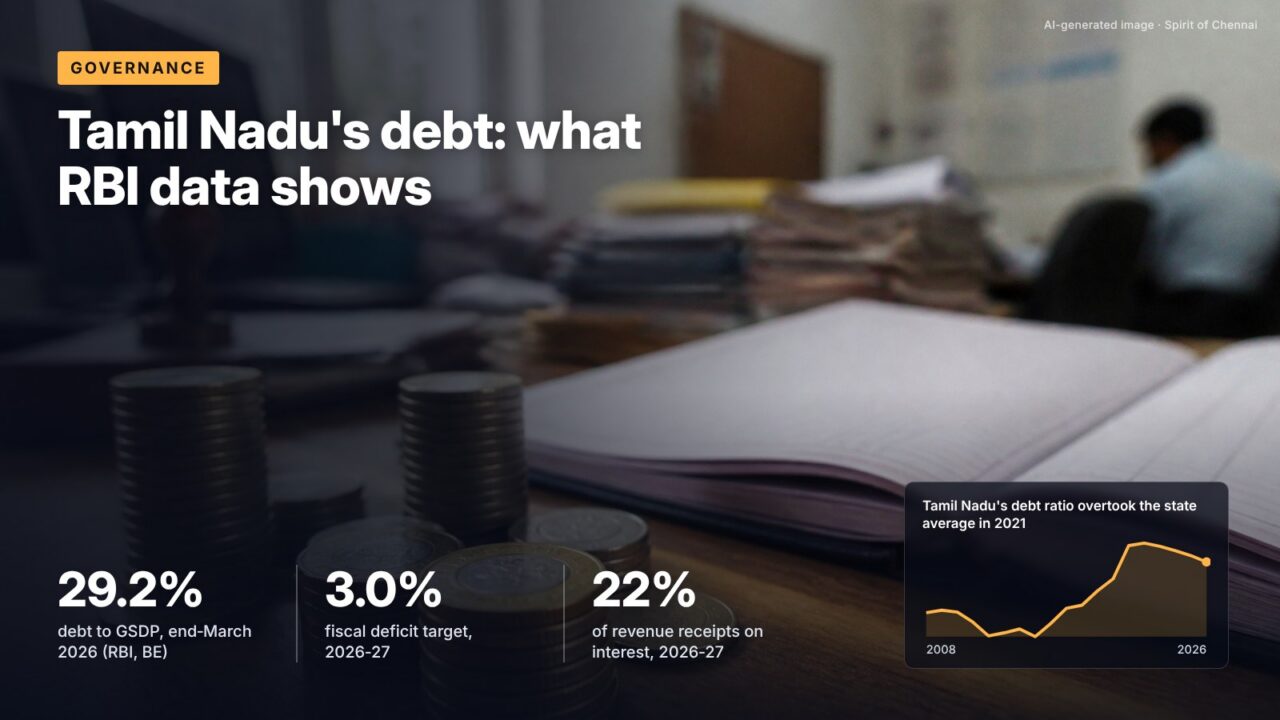
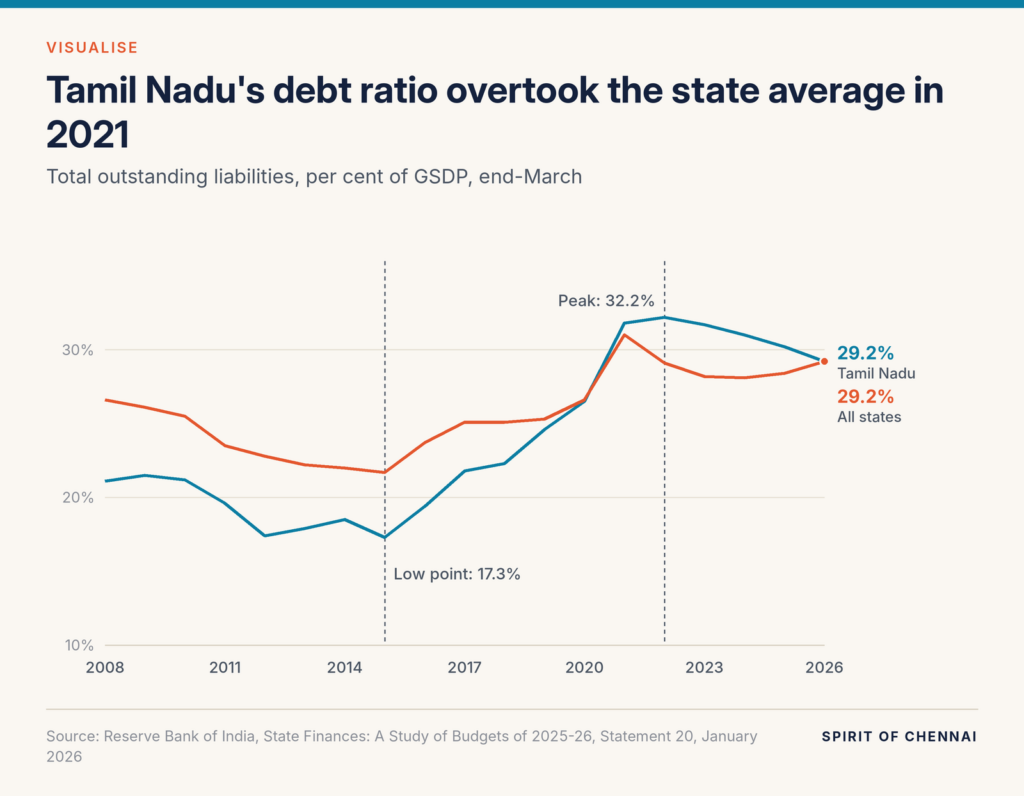
Tamil Nadu’s total outstanding liabilities stood at 29.2 per cent of its gross state domestic product (GSDP) at the end of March 2026, according to budget estimates compiled in the Reserve Bank of India’s State Finances: A Study of Budgets of 2025-26 (January 2026). That is down from a peak of 32.2 per cent in 2022, but well above the 17.3 per cent of 2015. For most of the 2010s the state carried less debt, relative to its economy, than the all-states average; since 2021 it has carried more.
The state’s own 2026-27 budget, presented on 5 August 2026, projects outstanding liabilities of 27 per cent of GSDP by March 2027 and a fiscal deficit of 3 per cent of GSDP, according to PRS Legislative Research’s analysis. The two sources use different GSDP estimates and vintages, which is why their ratios differ by about two points; the direction they show is the same.
How the debt ratio moved
| End-March | Tamil Nadu | All states and UTs |
|---|---|---|
| 2010 | 21.2% | 25.5% |
| 2015 | 17.3% | 21.7% |
| 2019 | 24.6% | 25.3% |
| 2020 | 26.5% | 26.6% |
| 2021 | 31.8% | 31.0% |
| 2022 | 32.2% | 29.1% |
| 2024 | 31.0% | 28.1% |
| 2025 (RE) | 30.2% | 28.4% |
| 2026 (BE) | 29.2% | 29.2% |
Source: Reserve Bank of India, State Finances: A Study of Budgets of 2025-26, Statement 20, January 2026 (the all-states row is per cent of GDP)
The climb began well before the pandemic. Between 2015 and 2019 the ratio rose by more than seven points, while the economy was still growing steadily. The 2020-21 collapse in revenue added another five points in a single year. Since 2022 the ratio has eased, mostly because nominal GSDP has grown faster than borrowing, not because borrowing has fallen.
What the 2026-27 budget borrows
PRS puts the fiscal deficit (the gap between total spending and non-debt receipts, which has to be borrowed) at ₹1,21,819 crore in 2026-27, or 3.0 per cent of GSDP. For 2025-26 the revised figure is ₹1,24,007 crore (3.5 per cent), against a budgeted 2.9 per cent. The revenue deficit, borrowing to pay for day-to-day spending rather than assets, is revised to ₹69,219 crore for 2025-26, 66 per cent above its budget estimate of ₹41,635 crore, and budgeted at ₹55,775 crore (1.4 per cent of GSDP) for 2026-27. The primary deficit, which strips out interest and shows whether the state is borrowing even to meet current costs before servicing old debt, is ₹45,362 crore (1.1 per cent). For comparison, the actual fiscal deficit for 2024-25 was ₹1,00,994 crore, or 3.2 per cent of GSDP.
Put simply, the state expects ₹3,50,766 crore of receipts other than borrowing in 2026-27 against net spending of ₹4,72,585 crore, in an economy PRS sizes at ₹40,67,312 crore. Gross borrowing in 2026-27 is ₹1,73,445 crore, of which ₹51,971 crore goes to repay old debt. In RBI’s compilation of 2025-26 budgets (Statement 3), Tamil Nadu’s budgeted fiscal deficit of ₹1,06,963 crore was about 9.1 per cent of the combined deficit of all states and union territories.
Share of Tamil Nadu’s 2026-27 revenue receipts committed to salaries, pensions and interest, against a 50 per cent average for states in 2025-26, according to PRS.
Why interest is the number to watch
Interest payments are budgeted at ₹76,456 crore in 2026-27, up 14 per cent on the revised 2025-26 figure and equal to 22 per cent of revenue receipts. Add salaries (₹91,032 crore) and pensions (₹47,240 crore) and committed spending reaches ₹2,14,728 crore. PRS notes that the share was 59 per cent in 2011-12, and cites a Madras School of Economics study for the 16th Finance Commission which found that part of the state’s borrowing since 2011-12 has paid for revenue spending rather than assets. Each rupee of interest is a rupee unavailable for capital works or new schemes.
The liabilities outside the headline
Outstanding liabilities exclude two large items. State guarantees on borrowing by public sector bodies stood at ₹1,79,782 crore on 31 March 2026, about 5 per cent of GSDP. Separately, the four power sector companies owed ₹2,47,130 crore on the same date, about 7 per cent of GSDP, and continue to depend on state loss funding: ₹16,077 crore in 2024-25 and a provisional ₹10,102 crore in 2025-26. If the state ever takes over any of that debt, it moves onto the state’s own books.
It’s often said Tamil Nadu is among the most indebted states in India.
The record shows By the ratio that matters for repayment, it sits in the middle. RBI’s Statement 20 puts Tamil Nadu at 29.2 per cent of GSDP for March 2026, below Punjab (46.4), West Bengal (38.9), Rajasthan (35.9), Kerala (35.5) and Andhra Pradesh (35.4), though above Karnataka (26.5), Maharashtra (19.0) and Gujarat (17.9). In absolute rupees its borrowing is among the largest because its economy is.
The rules the state has set itself
The Tamil Nadu Fiscal Responsibility Act, 2003 commits the state to progressively reduce its deficits and debt, and the 16th Finance Commission has recommended a 3 per cent of GSDP fiscal deficit ceiling for states over 2026-31. The 2026-27 budget meets that ceiling on paper. Central 50-year interest-free capital loans (₹4,000 crore budgeted for 2026-27) sit outside the borrowing limit. In July 2026 the government set up a committee chaired by Montek Singh Ahluwalia to recommend ways to raise revenue, PRS reports.
RBI’s methodology note explains that its state tables are compiled from budget documents, so the latest years are estimates that are later replaced by audited accounts.
What this means for you
- A rising interest bill is the clearest constraint on new schemes and capital works in Chennai and elsewhere; follow it in each budget.
- Compare budget estimates with revised estimates: the 2025-26 revenue deficit ended up two-thirds higher than planned.
- Power utility debt is the largest contingent risk; any takeover would push the state’s debt ratio up sharply.
- When comparing states, use one source and one year, because RBI and state budget ratios use different GSDP estimates.
What to watch
Pending
RBI’s next State Finances study, covering 2026-27 budgets, will update the debt ratios for every state on a common basis.
Pending
Recommendations of the Ahluwalia committee on revenue augmentation, set up in July 2026.
2026-31
The 16th Finance Commission’s 3 per cent fiscal deficit path for states applies through this period.
Checked against official sources on 23 October 2026. Figures and rules change; confirm on the linked official pages before relying on them.
Sources
- State Finances: A Study of Budgets of 2025-26, Statement 20: Total Outstanding Liabilities as per cent of GSDP, RBI, January 2026
- State Finances: A Study of Budgets of 2025-26, Statement 3: Gross Fiscal Deficit/Surplus, RBI, January 2026
- State Finances: A Study of Budgets, Explanatory Note on Data Sources and Methodology, RBI, January 2026
- State Finances: A Study of Budgets, list of statements and appendix tables, RBI
- Tamil Nadu Budget Analysis 2026-27, PRS Legislative Research, 2026