Solar panels are now the single biggest source of electricity capacity in Tamil Nadu. On 30 September 2026 the state had 14,354 MW of solar, ahead of 12,335 MW of wind and 12,203 MW of coal-fired plants, according to the Ministry of New and Renewable Energy and the Central Electricity Authority. Ten years ago solar was about a seventh the size of wind.
Put every power station in the state together and renewables, counting large hydro, make up about three-fifths of the roughly 49,000 MW installed. Coal, lignite and gas still hold about a third, and nuclear the rest. The picture below shows that mix, and the chart further down shows how fast solar caught up.
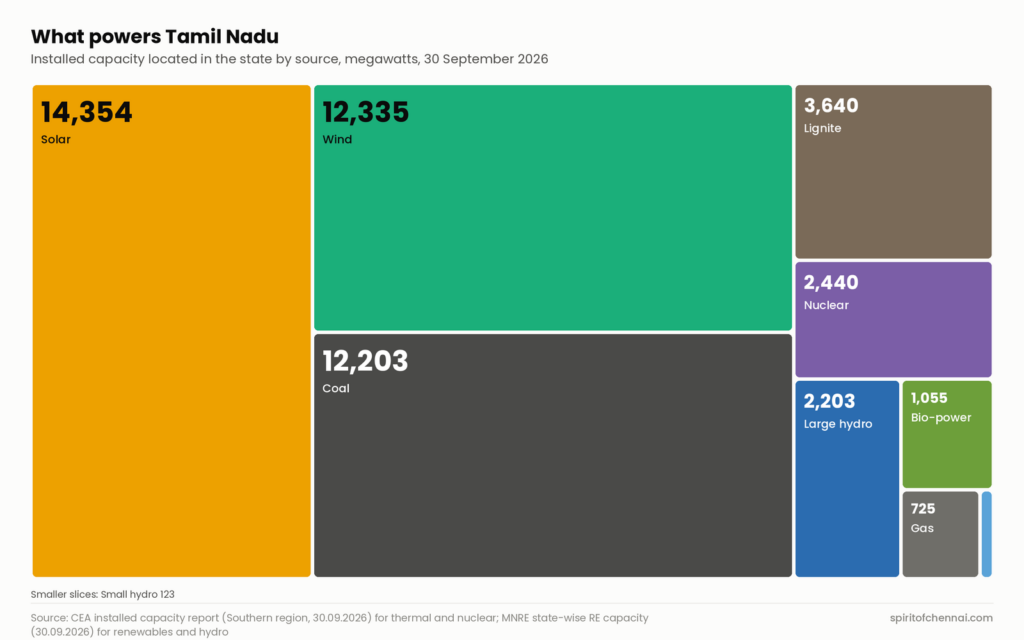
- Each block is one source of electricity. Its area is its share of all the generating capacity located in Tamil Nadu, and the big number is megawatts.
- Greens and yellows are renewable; the darker blocks are coal, lignite and gas plants, plus nuclear.
- Capacity is what plants can produce at full output, not what they actually generate. Wind and solar run far below full output most hours.
Solar and wind now outweigh coal
Wind, solar, bio-power and small hydro together make up 27,916 MW, or 57% of the 49,127 MW the CEA lists for Tamil Nadu. Coal plants account for 25% and lignite plants another 7%. Gas is a small 725 MW, and diesel capacity is now zero.
Nuclear power adds 2,440 MW and large hydro dams 2,203 MW. Counting those as clean too, two of every three megawatts in the state are not fuelled by coal, lignite or gas.
Most of this capacity is privately owned. The CEA puts 31,764 MW in the private sector, against 8,652 MW owned by the state and 8,711 MW by central government undertakings.
How solar overtook wind
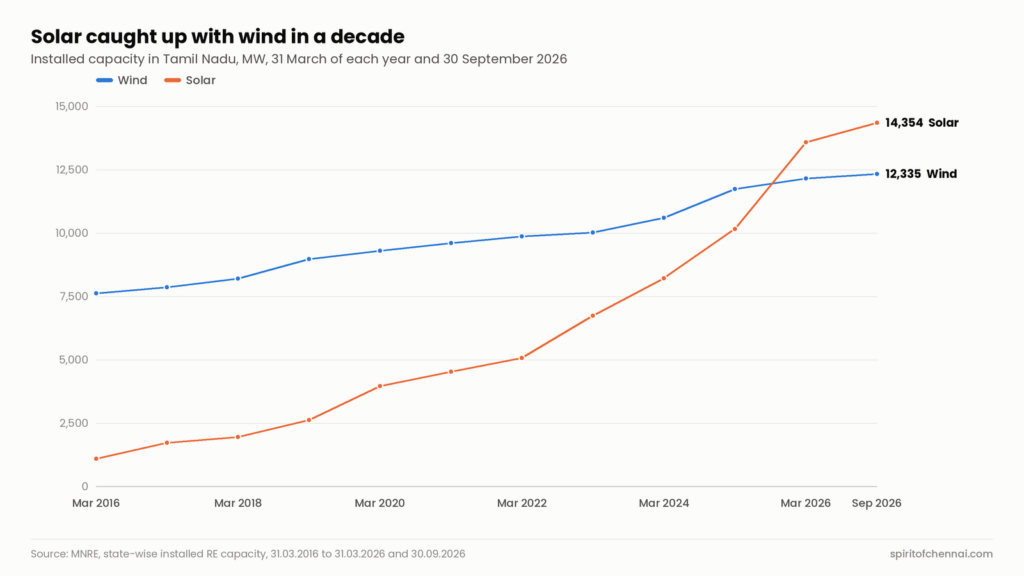
Tamil Nadu built its wind fleet early, and it has kept growing slowly: from 7,614 MW in March 2016 to 12,335 MW now, an increase of about 62%. Solar started from 1,091 MW and has grown thirteen-fold. It overtook wind during 2025-26: in March 2025 wind was still ahead, at 11,740 MW against 10,154 MW, but by March 2026 solar led by more than 1,400 MW.
The steepest jump came in that one year, when about 3,400 MW of solar was added, the MNRE’s March 2025 and March 2026 tables show. Rooftop panels are a growing part of it: 1,636 MW in September 2026, up from 932 MW in March 2025.
Solar capacity in Tamil Nadu on 30 September 2026, up from 1,091 MW in March 2016, per the MNRE’s state-wise table.
The numbers behind the graphic
| Source, 30 September 2026 | MW |
|---|---|
| Solar (ground-mounted, rooftop, hybrid) | 14,353.58 |
| Wind | 12,335.42 |
| Coal | 12,202.50 |
| Lignite | 3,640.00 |
| Nuclear | 2,440.00 |
| Large hydro | 2,203.20 |
| Bio-power | 1,055.12 |
| Gas | 724.58 |
| Small hydro | 123.05 |
| CEA total, all sources | 49,126.76 |
| of which renewable (CEA “RES”) | 27,916.48 |
| As on | Wind (MW) | Solar (MW) |
|---|---|---|
| Mar 2016 | 7,613.89 | 1,090.57 |
| Mar 2017 | 7,861.46 | 1,728.52 |
| Mar 2018 | 8,197.09 | 1,950.86 |
| Mar 2019 | 8,968.91 | 2,618.71 |
| Mar 2020 | 9,304.34 | 3,961.56 |
| Mar 2021 | 9,608.04 | 4,527.47 |
| Mar 2022 | 9,866.37 | 5,067.18 |
| Mar 2023 | 10,017.17 | 6,736.43 |
| Mar 2024 | 10,603.54 | 8,211.38 |
| Mar 2025 | 11,739.91 | 10,153.58 |
| Mar 2026 | 12,147.23 | 13,579.67 |
| Sep 2026 | 12,335.42 | 14,353.58 |
Source: CEA, location-wise state installed capacity, Southern region, as on 30.09.2026 (coal, lignite, gas, nuclear, totals); MNRE, state-wise RE installed capacity as on 30.09.2026 (solar, wind, bio, hydro); MNRE state-wise cumulative capacity as on 31 March of each year, 2016 to 2026, from its year-wise achievement page.
About the data
The CEA counts every plant located in Tamil Nadu, whoever owns it, so this is not the same as the power Tamil Nadu buys: some central plants here sell to other states, and the state also draws power from plants elsewhere. The treemap uses the MNRE’s split of renewables, which adds up to 49 MW less than the CEA’s renewable total for the same date; the two agencies compile their figures separately.
The yearly series uses the MNRE’s 31 March tables, which do not always include off-grid solar, so small differences between years can reflect reporting changes. Capacity is not generation: wind output rises and falls with the seasons and solar works only in daylight, so a megawatt of solar produces far fewer units in a year than a megawatt of coal. Generation by source is not shown here.
Quick answers
What is Tamil Nadu’s total installed power capacity?
The CEA lists 49,126.76 MW located in Tamil Nadu as on 30 September 2026, across state, private and central plants.
Which source has the most capacity in Tamil Nadu?
Solar, at 14,353.58 MW in September 2026, followed by wind at 12,335.42 MW and coal at 12,202.50 MW.
When did solar overtake wind in Tamil Nadu?
Between March 2025 and March 2026, going by the MNRE’s year-end tables.
Information checked against official sources on 21 October 2026. Figures can be revised; confirm on the linked official pages before relying on them.
Sources
- Location-wise Southern region state-wise installed capacity as on 30.09.2026 (Central Electricity Authority, via National Power Portal)
- State-wise RE installed capacity as on 30.09.2026 (Ministry of New and Renewable Energy)
- Year-wise achievement and state-wise cumulative capacity (Ministry of New and Renewable Energy)
- State-wise installed capacity of renewable power as on 31.03.2026 (MNRE)
- State-wise installed capacity of renewable power as on 31.03.2025 (MNRE)
- State-wise installed capacity of grid-interactive renewable power as on 31.03.2016 (MNRE)