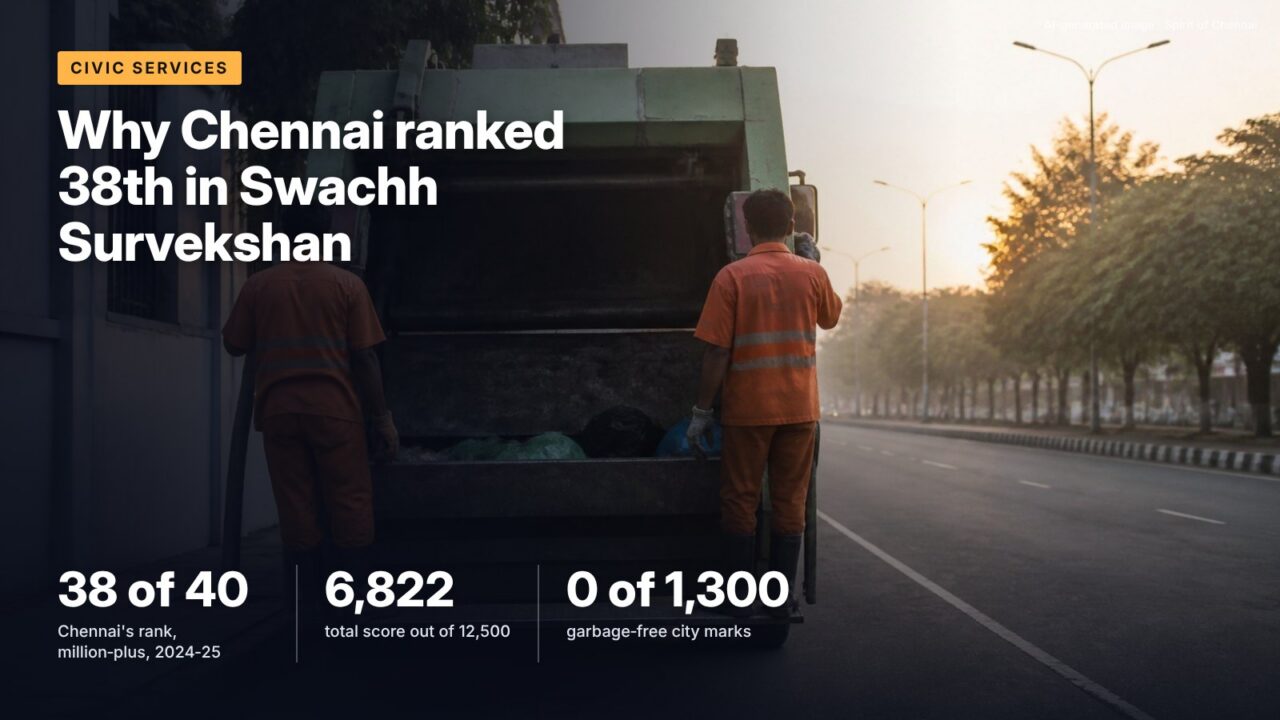
In the 2024-25 Swachh Survekshan, Chennai finished 38th of 40 million-plus cities, ahead of only Ludhiana and Madurai. The scorecard shows the gap is not about toilets. It is about what happens to the city’s garbage after it is collected.
The numbers
Chennai scored 6,822 out of 12,500 in Swachh Survekshan 2024-25, the Union housing ministry’s national cleanliness survey. That put it 38th in the 40-city million-plus category, according to the million-plus ranking table published with the final report. Ahmedabad topped the group with 12,079. Coimbatore, the other big Tamil Nadu city, came 28th with 8,347, and Madurai was last with 4,823.
The breakdown is more telling than the rank. Chennai collected all 1,200 marks for open-defecation-free certification, the maximum in that section. It got zero of the 1,300 marks available for a Garbage Free City star rating. On the main field assessment, worth 10,000 marks, it scored 6,327, more than 3,200 marks behind the leaders.
How the survey is scored
The 2024-25 survey assessed 4,589 urban local bodies and for the first time grouped them into five population bands, with million-plus cities (over 10 lakh people) judged against each other. Of the 12,500 marks, 10,000 came from a four-phase assessment and 2,500 from certification: up to 1,300 for the Garbage Free City star rating (500 for one star, rising to 1,300 for seven) and up to 1,200 for the open-defecation-free ladder.
| Assessment section | Weight | Marks |
|---|---|---|
| Visible cleanliness | 15% | 1,500 |
| Segregation, collection and transport of waste | 10% | 1,000 |
| Solid waste management (processing) | 15% | 1,500 |
| Access to sanitation | 10% | 1,000 |
| Used water management | 10% | 1,000 |
| Mechanised desludging | 5% | 500 |
| Advocacy for Swachhta | 15% | 1,500 |
| Institutional strengthening | 10% | 1,000 |
| Welfare of sanitation workers | 5% | 500 |
| Citizen feedback and grievances | 5% | 500 |
Source: Ministry of Housing and Urban Affairs, Swachh Survekshan 2024-25 report, section weights
The report does not publish Chennai’s section-by-section marks, so it is not possible to say from official data exactly which sections cost the city most. What can be said is where the certification marks went, and that the city’s field score sits well below its peers.
Chennai against other big cities
| City | Rank | Total (12,500) | Field score (10,000) | GFC (1,300) | ODF (1,200) |
|---|---|---|---|---|---|
| Ahmedabad | 1 | 12,079 | 9,579 | 1,300 | 1,200 |
| Greater Hyderabad | 6 | 11,805 | 9,350 | 1,300 | 1,200 |
| Pune | 8 | 11,653 | 9,393 | 1,100 | 1,200 |
| Coimbatore | 28 | 8,347 | 7,587 | 0 | 1,000 |
| Delhi (MCD) | 31 | 7,920 | 7,080 | 500 | 1,200 |
| Greater Mumbai | 33 | 7,419 | 6,894 | 0 | 750 |
| Bengaluru (BBMP) | 36 | 6,842 | 6,247 | 0 | 1,200 |
| Chennai | 38 | 6,822 | 6,327 | 0 | 1,200 |
| Madurai | 40 | 4,823 | 4,643 | 0 | 1,000 |
Source: MoHUA, Swachh Survekshan 2024-25, Million Plus Cities Ranking
The pattern is plain in the GFC column. Each of the top 22 cities had at least a three-star garbage-free rating (800 marks or more), and the top 13 had five or seven stars. Chennai, Bengaluru and Mumbai had none. A one-star rating alone would have added 500 marks and lifted Chennai’s total to 7,322, still below Greater Mumbai’s 7,419 and around 35th place. Certification helps, but the field score is the bigger gap.
Field-assessment marks separating Chennai (6,327) from Ahmedabad (9,579) in the 2024-25 million-plus table, larger than the entire certification component.
Where the garbage goes
The Garbage Free City protocol rewards cities that process their waste and clean up old dumps. Chennai’s numbers explain the zero. The Corporation’s solid waste management page says about 6,150 tonnes are collected every day, and lists the two dumpsites as receiving 2,600 to 2,800 tonnes (Kodungaiyur, about 269 acres) and 2,400 to 2,600 tonnes (Perungudi, about 200 acres) a day. Both have been in use for more than 35 years. Taken together, those figures mean most of the city’s daily collection still goes to land rather than to processing.
Decentralised processing exists but is small by comparison: 196 compost units with a capacity of about 142 tonnes a day, 23 biogas plants with about 9 tonnes a day and five small waste-to-energy units with 8.8 tonnes a day, according to the same page. It records 100 acres reclaimed at Perungudi through biomining and a biomining tender opened for Kodungaiyur in August 2023.
Nationally, the Union government told the Lok Sabha in November 2024 that 2,417 dumpsites holding 24.88 crore tonnes of legacy waste had been identified, and that 51% of that waste had been remediated. Tamil Nadu’s Swachh Bharat Mission (Urban) 2.0 allocation for 2021-26 is listed at 3,296.70 in the answer’s annexure (units not stated), with 807.40 for solid waste.
It’s often said Chennai ranks low because the city lacks toilets.
The record shows Chennai received the full 1,200 marks for open-defecation-free certification in 2024-25. Its shortfall lies in the field assessment and the 1,300 garbage-free marks, which depend on waste processing and dumpsite clean-up.
The marks that depend on residents
Two sections reward public engagement rather than infrastructure: advocacy for Swachhta (1,500 marks) and citizen feedback and grievance redressal (500 marks). Together they are a fifth of the field assessment. Visible cleanliness, another 1,500 marks, is judged by assessors walking streets, markets and water bodies, so littering and roadside dumping count directly against the city.
The 2024-25 survey also created a Super Swachh League for cities that ranked in the top three at least once in the previous three years and stayed in the top 20% of their category. Chennai is nowhere near that group. Because 2024-25 was the first year cities were grouped into five population bands, its rank is not directly comparable with earlier surveys, which used different categories and mark totals.
Used water counts too
A tenth of the field marks go to used water management, which is Metro Water’s domain. Its Annual Performance Report 2023-24 lists 899.80 MLD of installed sewage treatment capacity and two 45 MLD tertiary plants at Koyambedu and Kodungaiyur that recycle treated sewage for industry. Those plants were supplying 15 and 23 MLD respectively, well below capacity. Reuse is one of the things assessors look for.
What this means for you
- Source segregation at home feeds directly into two of the scored sections: collection and processing.
- The citizen-feedback section (500 marks) depends on residents responding to the survey and using the 1913 and app grievance channels.
- Rankings compare cities within a population band, so Chennai’s 38th is out of 40, not out of 4,589.
- The biggest single lever for the city is a garbage-free star rating, which needs reduced dumping and visible clean-up at Kodungaiyur and Perungudi.
What to watch
Pending
The ministry has not announced dates for the next survey round on the documents reviewed. Field assessment usually precedes results by several months.
Pending
Progress of biomining at Kodungaiyur, tendered in August 2023, will decide whether Chennai can apply for a garbage-free star rating.
Checked against official sources on 23 October 2026. Figures and rules change; confirm on the linked official pages before relying on them.
Sources
- Swachh Survekshan 2024-25 final report, Ministry of Housing and Urban Affairs, 2025 (hosted by OpenCity)
- Swachh Survekshan 2024-25 Million Plus Cities Ranking, MoHUA, 2025 (CSV hosted by OpenCity)
- Solid Waste Management Department, Greater Chennai Corporation, 2026
- Lok Sabha Unstarred Question 682, Solid Waste Management Challenges, 28 November 2024
- Annual Performance Report 2023-24, Chennai Metropolitan Water Supply and Sewerage Board