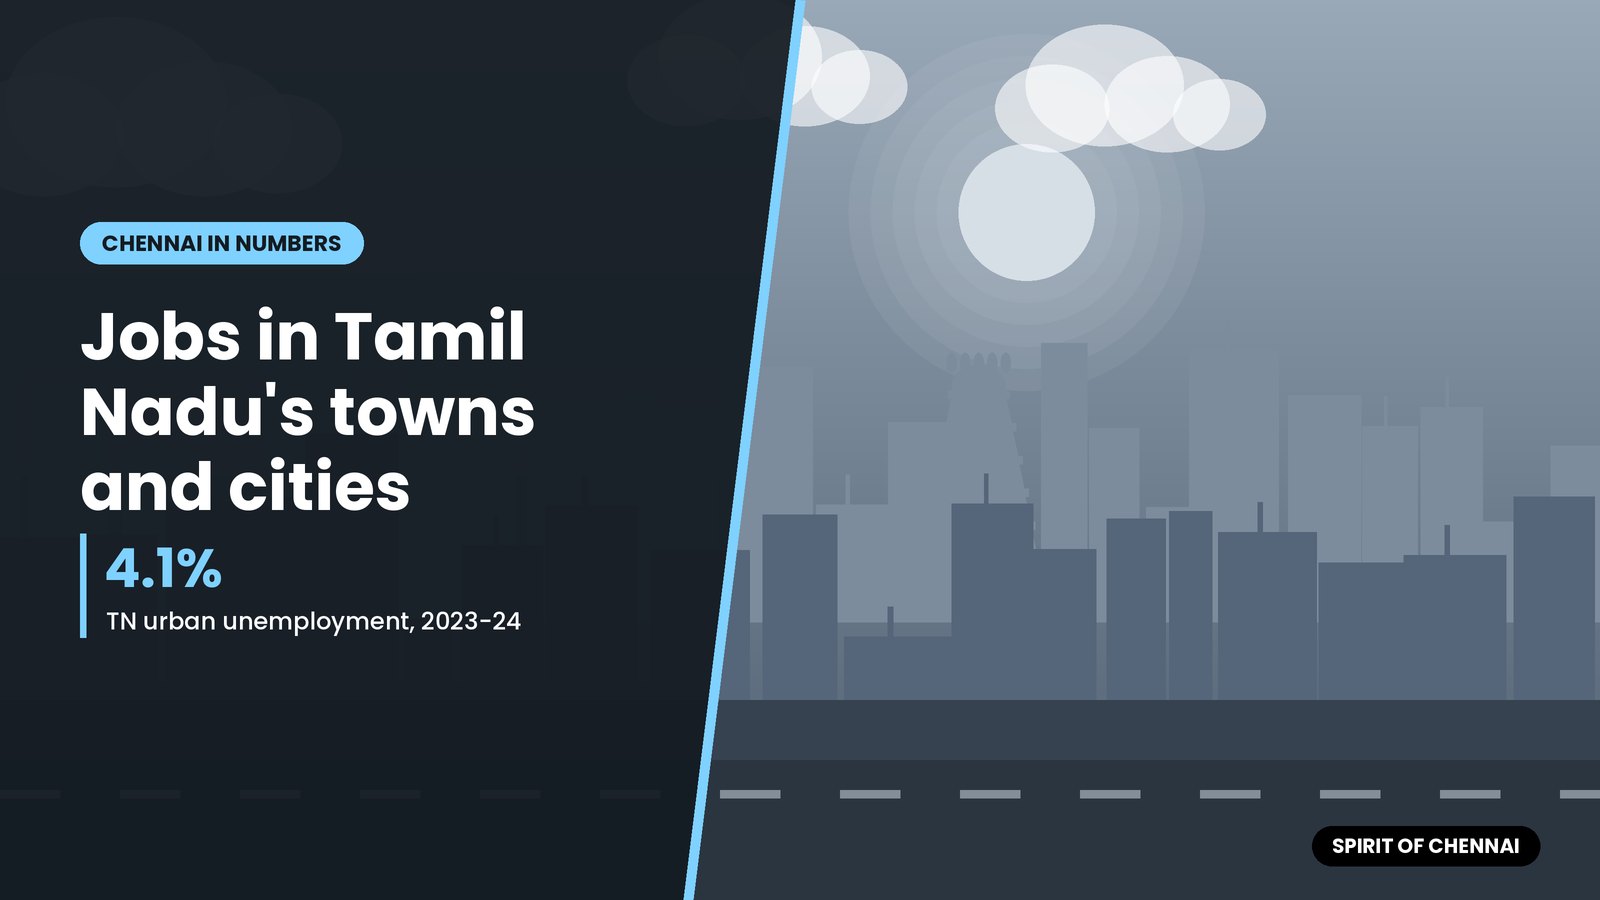
Urban unemployment in Tamil Nadu fell to 4.1% in 2023-24, from 7.2% in 2017-18, according to Periodic Labour Force Survey (PLFS) figures compiled by the Reserve Bank of India. That was below the all-India urban rate of 5.1% the same year. Women in the state’s towns and cities, however, still faced an unemployment rate of 6.0%, nearly twice the 3.2% for men.
No official survey publishes a separate unemployment rate for Chennai. But the city accounts for a large share of urban Tamil Nadu’s workforce, so the state’s urban series is the closest measure available. Here is what it shows, with the latest national readings for context.
Urban Tamil Nadu, year by year
The table below is from Table 9 of the RBI’s Handbook of Statistics on Indian States, published in December 2025. It uses the “usual status (adjusted)” measure, which looks at a person’s main activity over the previous year plus any subsidiary work. The RBI reports the rates per thousand; they are converted to percentages here.
| Year (survey) | TN urban men | TN urban women | TN urban, all | India urban, all |
|---|---|---|---|---|
| 2011-12 (NSS) | 2.1% | 4.5% | 2.7% | 3.4% |
| 2017-18 (PLFS) | 6.5% | 9.0% | 7.2% | 7.8% |
| 2018-19 | 6.0% | 8.4% | 6.7% | 7.7% |
| 2019-20 | 5.3% | 6.9% | 5.8% | 7.0% |
| 2020-21 | 5.1% | 7.5% | 5.8% | 6.7% |
| 2021-22 | 5.6% | 5.8% | 5.7% | 6.3% |
| 2022-23 | 4.3% | 7.0% | 5.1% | 5.4% |
| 2023-24 | 3.2% | 6.0% | 4.1% | 5.1% |
The jump between 2011-12 and 2017-18 is partly a change of survey. Figures up to 2011-12 come from the NSS 68th round; from 2017-18 onward they come from the PLFS, which uses a different design. The RBI warns against reading the two as one unbroken line.
Within the PLFS years, the trend is clear. Urban unemployment in Tamil Nadu has fallen in most years and stayed below the national urban rate throughout. The pandemic year 2020-21 shows only a small rise on this annual measure, because it averages the whole year.
Rural Tamil Nadu for comparison
The RBI’s rural table shows Tamil Nadu’s rural unemployment at 3.1% in 2023-24 (3.5% for men and 2.7% for women), down from 7.9% in 2017-18. Unlike urban Tamil Nadu, rural Tamil Nadu has had higher unemployment than rural India: the national rural rate in 2023-24 was 2.5%.
| 2023-24, usual status (adjusted) | Tamil Nadu | India |
|---|---|---|
| Urban | 4.1% | 5.1% |
| Rural | 3.1% | 2.5% |
| Urban women | 6.0% | 7.1% |
| Rural women | 2.7% | 2.1% |
The latest national readings
From 2025, the PLFS moved to calendar-year annual reports and a monthly and quarterly series. The PLFS Annual Report 2025 press note, released on 27 March 2026, put India’s urban unemployment at 4.8% for January to December 2025 (4.2% for men and 6.4% for women) on the usual status measure. State tables are in the full report, which this article could not open.
The quarterly bulletins use a stricter “current weekly status” measure, which counts anyone who did not find even an hour’s work in the reference week. On that basis, India’s urban unemployment was:
| Quarter | India urban unemployment (CWS) |
|---|---|
| April-June 2025 | 6.8% |
| July-September 2025 | 6.9% |
| October-December 2025 | 6.7% |
| January-March 2026 | 6.6% |
| April-June 2026 | 6.7% |
Sources: the January-March 2026 press note and the April-June 2026 bulletin. In the April-June 2026 quarter, urban women’s unemployment was 8.7% nationally, and only 22.8% of urban women aged 15 and above were working. The bulletins give state figures for selected states in their annex tables, which were not part of the press notes reviewed here.
What this means for Chennai
- Two measures, two answers. Usual-status rates (around 4 to 5%) and weekly-status rates (around 6 to 7%) are both official. Check which one a headline is quoting.
- Women’s jobs are the gap. In every year of the urban series, unemployment among women in Tamil Nadu’s towns was higher than among men, and in most years it was well above.
- No city figure. Claims about “Chennai’s unemployment rate” are usually estimates or private surveys. The PLFS sample is not designed to give reliable district numbers.
Job seekers can register with the state employment exchange online and look for listings on the state’s private job portal; both are free.
Quick answers
What is the unemployment rate in urban Tamil Nadu?
4.1% in 2023-24 on the PLFS usual status (adjusted) measure, per RBI’s state handbook.
Is there an official unemployment rate for Chennai?
No. PLFS publishes state, not city, estimates. Urban Tamil Nadu is the nearest official figure.
What is India’s latest urban unemployment rate?
6.7% in April-June 2026 on the weekly status measure, and 4.8% for calendar 2025 on the usual status measure.
Why is women’s unemployment higher?
The surveys show fewer women in the labour force and a higher share of those looking for work not finding it; the data does not itself give reasons.
Information checked against official sources on 18 October 2026. Fees, dates and rules can change; confirm on the linked official pages before acting.
Sources
- Handbook of Statistics on Indian States, Table 9: State-wise Unemployment Rate, Usual Status (Adjusted), Urban (Reserve Bank of India, December 2025)
- Handbook of Statistics on Indian States, Table 8: State-wise Unemployment Rate, Usual Status (Adjusted), Rural (Reserve Bank of India, December 2025)
- Press Note: PLFS Annual Report 2025, January-December 2025 (Ministry of Statistics and Programme Implementation)
- PLFS Quarterly Bulletin, April-June 2026 (MoSPI, via PIB)
- Press Note: PLFS Quarterly Bulletin, January-March 2026 (MoSPI)