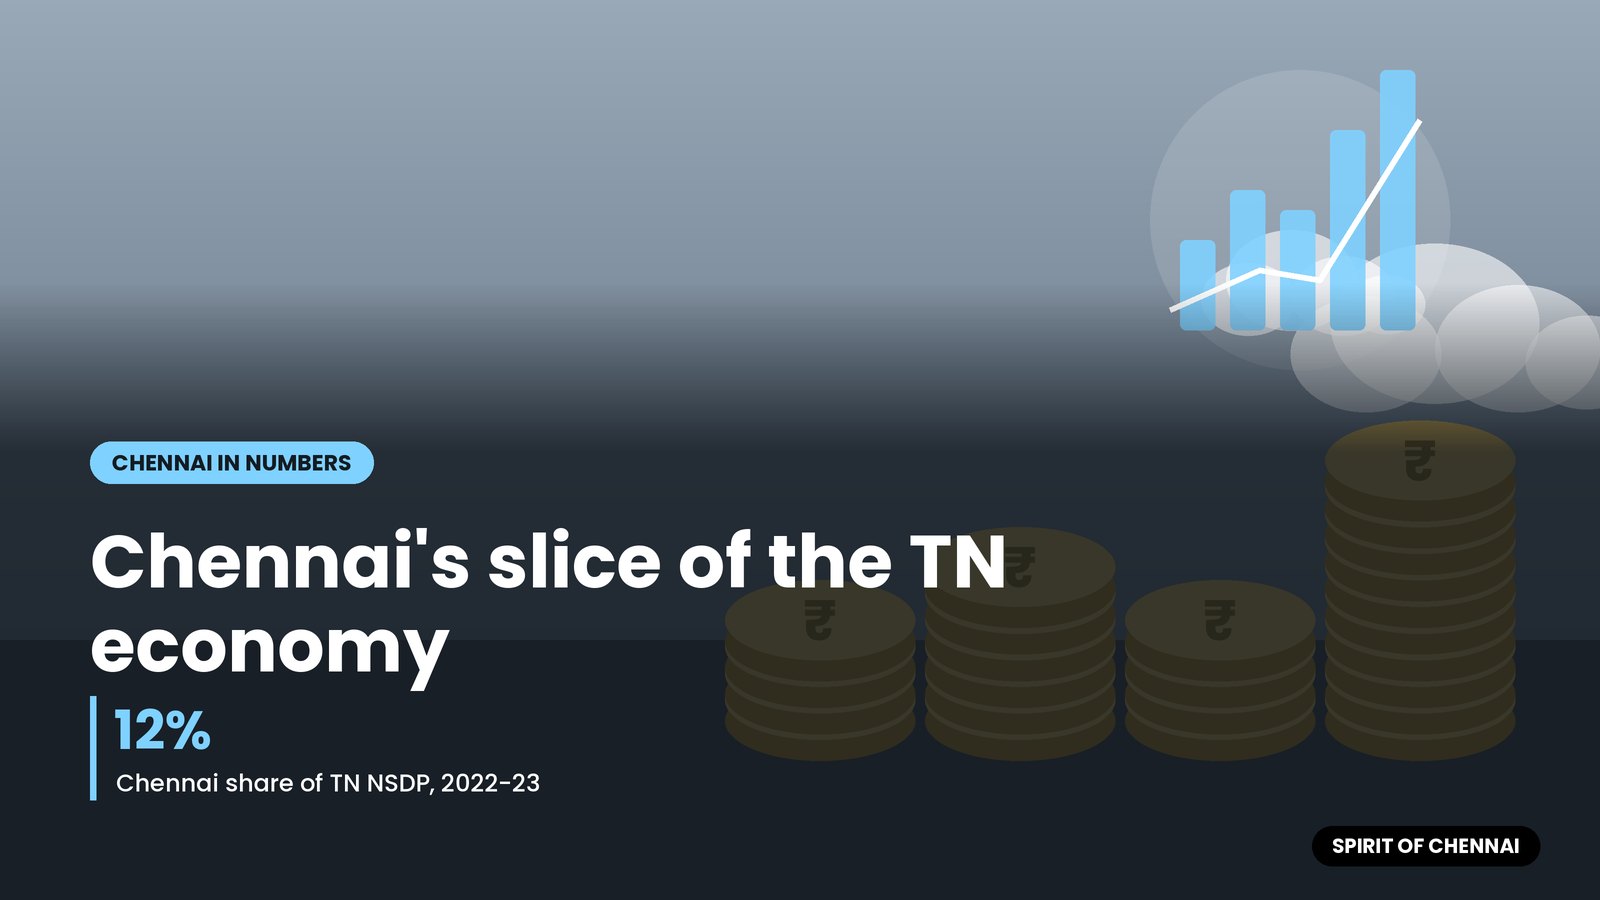
Chennai district produced about ₹2.57 lakh crore of net output in 2022-23 at current prices, roughly 12% of Tamil Nadu’s net state domestic product that year. That is the most recent district-level figure in the state’s official statistical handbook, and it sits inside a state economy now estimated at over ₹40 lakh crore for 2026-27.
State income numbers come in several versions (gross and net, current and constant prices, budget and revised estimates), and news reports often mix them. Below, each figure is labelled with its type and year so you can compare like with like.
Tamil Nadu’s economy: the headline figures
PRS Legislative Research’s analysis of the 2026-27 state budget, presented on 5 August 2026 by Finance Minister N. Marie Wilson, gives these gross state domestic product (GSDP) figures at current prices:
| Year | Nominal GSDP | Type of estimate |
|---|---|---|
| 2024-25 | ₹31,15,998 crore | Actual, per budget documents |
| 2025-26 | ₹35,67,818 crore | Revised estimate |
| 2026-27 | ₹40,67,312 crore | Budget estimate, 14% above 2025-26 |
PRS adds that GSDP at constant prices, which strips out inflation, was estimated to grow 11% in 2025-26, against 8% for India’s GDP. Per capita GSDP for 2025-26 was put at ₹4,55,650, compared with ₹2,43,803 for India.
The state’s Economic Survey 2025-26, released in February 2026, reported real growth of 11.19% for 2024-25, the highest in 14 years, according to The South First’s report on the survey. It said manufacturing grew 14.74% and services 11.3% that year, and that the state’s per capita income was ₹3.62 lakh, about 1.77 times the national figure. Per capita income in that report is a different measure from the per capita GSDP above, which is why the two numbers differ.
What the economy is made of
At current prices in 2025-26, PRS breaks Tamil Nadu’s output into three broad sectors:
- Services: about 54%, the largest share, covering trade, IT, finance, real estate, transport and public administration.
- Manufacturing and industry: about 34%. The Economic Survey says the state accounts for 12.65% of India’s manufacturing output.
- Agriculture and allied activities: about 13%.
Chennai’s weight lies mostly in services and in the manufacturing belt along its edges, though the district tables do not split output by sector.
Chennai district’s share, year by year
The State Income chapter of the Statistical Hand Book 2022-23, from the Department of Economics and Statistics, publishes net district domestic product (NDDP) for every district, with 2011-12 as the base year. The handbook gives values in rupees lakh; they are converted to crore below.
| Year | Chennai NDDP, current prices | Tamil Nadu NSDP, current prices | Chennai share |
|---|---|---|---|
| 2015-16 | ₹94,341 crore | ₹10,57,084 crore | 8.9% |
| 2018-19 | ₹1,22,550 crore | ₹14,68,449 crore | 8.3% |
| 2019-20 | ₹1,88,479 crore | ₹15,64,831 crore | 12.0% |
| 2020-21 | ₹1,92,209 crore | ₹15,98,520 crore | 12.0% |
| 2021-22 | ₹2,17,606 crore | ₹18,54,762 crore | 11.7% |
| 2022-23 (provisional) | ₹2,57,067 crore | ₹21,32,546 crore | 12.1% |
The share column is simple division of the two handbook figures. Note the jump between 2018-19 and 2019-20: Chennai’s NDDP rose by more than half in one year while the state total grew far less. The handbook does not explain the break, so treat comparisons across those two years with caution. At constant prices, Chennai’s NDDP was ₹1,57,000 crore in 2022-23, up from ₹78,983 crore in 2015-16.
The handbook does not publish a per capita figure for Chennai district in this table, and dividing by an outdated 2011 population would mislead, so none is given here.
How to read these numbers
- Gross vs net: GSDP includes depreciation of machinery and buildings; NSDP and NDDP exclude it, so net figures are always smaller.
- Current vs constant prices: current prices include inflation. For real growth, use constant-price series.
- Estimates get revised: the 2025-26 GSDP was ₹36,56,757 crore in the original budget estimate and ₹35,67,818 crore in the revised estimate. The Economic Survey’s ₹31.19 lakh crore for 2024-25 also differs slightly from the budget’s ₹31,15,998 crore. Always note which version a report is quoting.
- District figures lag: district income is published a few years behind state income, so 2022-23 is the latest available for Chennai in the handbook.
Debt and the wider picture
PRS estimates the state’s outstanding liabilities at 27% of GSDP at the end of 2026-27, slightly lower than 27.4% in the 2025-26 revised estimate. These ratios move with GSDP, so faster nominal growth can lower the debt ratio even when borrowing rises.
Quick answers
What is Tamil Nadu’s GSDP?
₹40,67,312 crore at current prices for 2026-27 (budget estimate), and ₹35,67,818 crore for 2025-26 (revised estimate).
How fast is Tamil Nadu’s economy growing?
Real growth was 11.19% in 2024-25 per the Economic Survey, and an estimated 11% in 2025-26 per PRS.
How big is Chennai’s economy?
Chennai district’s net domestic product was about ₹2.57 lakh crore at current prices in 2022-23 (provisional), around 12% of the state’s NSDP.
Where can I find district income data?
In the State Income chapter of the Statistical Hand Book on the Department of Economics and Statistics website.
Information checked against official sources on 18 October 2026. Fees, dates and rules can change; confirm on the linked official pages before acting.
Sources
- Tamil Nadu Budget Analysis 2026-27 (PRS Legislative Research)
- Statistical Hand Book of Tamil Nadu 2022-23, Chapter 34: State Income (Department of Economics and Statistics, Government of Tamil Nadu)
- TN Economic Survey: record 2024-25 growth keeps state on course for $1 trillion economy (The South First, February 2026)