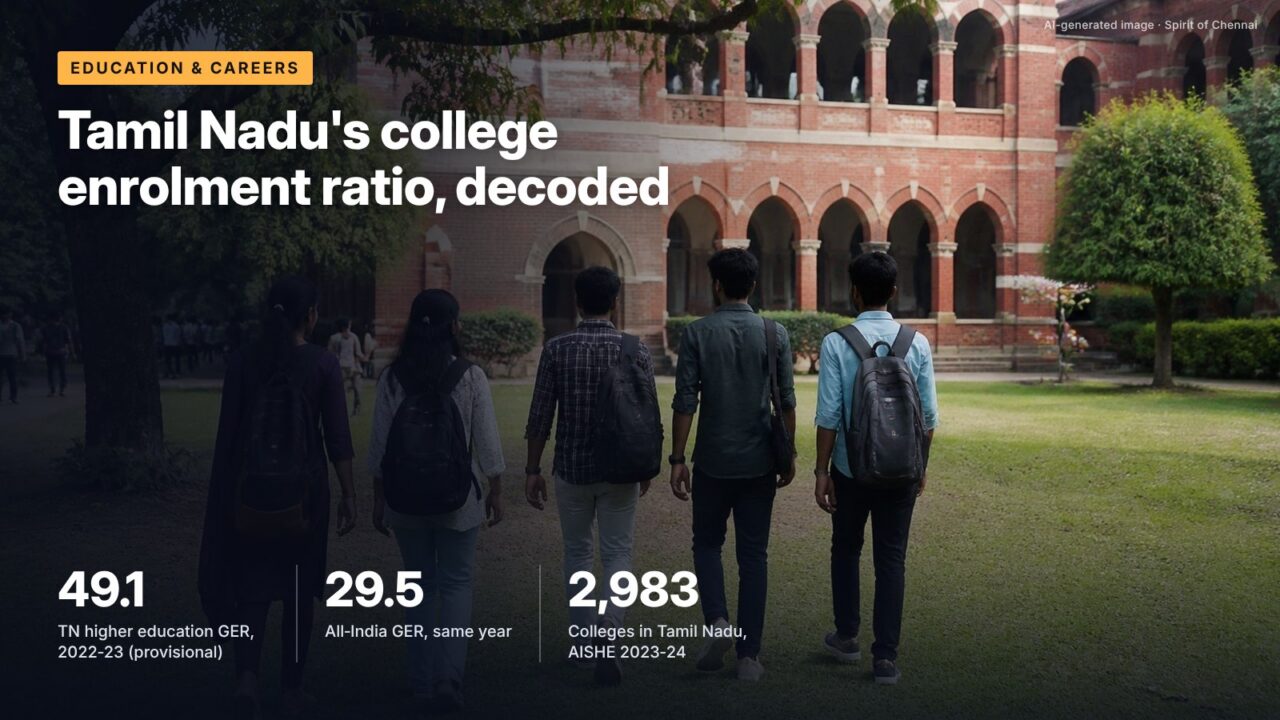
Tamil Nadu sends close to half its 18 to 23 year olds into higher education, against under a third nationally. The headline ratio is real, but reading it well means knowing what sits in the denominator, why the state’s own figure once looked higher, and where the gaps still lie.
The numbers
The most recent state-wise Gross Enrolment Ratio the Union Ministry of Education has placed before Parliament puts Tamil Nadu at 49.1 for 2022-23. That figure, from the provisional All India Survey on Higher Education (AISHE) and tabled in Lok Sabha Unstarred Question 4114 on 18 August 2025, compares with 29.5 for India as a whole. Women in Tamil Nadu (49.3) are enrolled at a slightly higher ratio than men (48.8).
The Gross Enrolment Ratio, or GER, is simple arithmetic: everyone enrolled in a university, college or standalone institution, of any age, divided by the estimated population aged 18 to 23, multiplied by 100. Because older students and repeaters count in the numerator, GER is a measure of system size, not the share of young people actually in college. Its weak point is the denominator, which is a projection rather than a count.
That detail explains most of the confusion about Tamil Nadu’s number over the past five years.
Why 51.4 became 47
The Higher Education Department’s policy note for 2021-22 told the Assembly that Tamil Nadu’s GER was 51.4 against a national 27.1, figures taken from AISHE 2019-20. A year later the AISHE 2021-22 state table put Tamil Nadu at 47. Read side by side, that looks like a fall of more than four points.
It is not a like-for-like comparison. The ministry has since recalculated the whole series on population projections based on the 2011 Census. In that revised time series, India’s 2019-20 GER is 25.6, not the 27.1 printed in the original 2019-20 report. The enrolment did not change; the estimate of how many 18 to 23 year olds exist did. Any state figure from the older reports sits on a different base from today’s tables.
It’s often said Tamil Nadu’s college enrolment ratio slipped after 2019-20, from above 51 to 47.
The record shows The two numbers use different population estimates. On the ministry’s re-based series India’s own 2019-20 GER drops from 27.1 to 25.6 with no change in students counted. Tamil Nadu’s enrolment rose from 33.09 lakh in 2021-22 (AISHE 2021-22) to 34.0 lakh in 2022-23 (AISHE 2022-23).
How Tamil Nadu compares with its neighbours
On the common 2021-22 base, Tamil Nadu led the large southern states. Puducherry, a small Union Territory, posted 61.5, but among states with more than a crore of people Tamil Nadu was clear of Kerala and Telangana.
| State | GER 2021-22 | Colleges per lakh (18-23) |
|---|---|---|
| Tamil Nadu | 47.0 | Not in report text |
| Kerala | 41.3 | 46 |
| Telangana | 40.0 | Not in report text |
| Andhra Pradesh | 36.5 | Not in report text |
| Karnataka | 36.2 | 66 |
| Maharashtra | 35.3 | Not in report text |
| All India | 28.4 | 30 |
Source: Ministry of Education, AISHE 2021-22, as tabled in Lok Sabha Unstarred Questions 93 (4 December 2023) and 344 (5 February 2024); college density from the AISHE 2021-22 report text.
The comparison also shows that Tamil Nadu does not lead because it has the most colleges per head. Karnataka had 66 colleges per lakh of eligible population in 2021-22 and 68 in 2022-23, well above Tamil Nadu’s 43 in AISHE 2023-24. Karnataka’s colleges are smaller. Tamil Nadu packs more students into each institution and, unusually, does it with more teachers: its pupil-teacher ratio of 14 in regular courses in 2021-22 was among the best of the six largest states, against 24 nationally.
What drives the ratio
The first driver is upstream. Higher education can only enrol people who finish school. Tamil Nadu’s GER at the higher secondary stage (Classes 11 and 12) was 82.9 in 2023-24, against 56.2 for India, according to figures tabled in Lok Sabha in February 2025. A state that keeps three in four of its teenagers in school to Class 12 will have a large pool for colleges.
The second is supply. The state’s Higher Education policy note for 2025-26 lists 61 universities (2 central, 29 deemed, 8 private and 22 state) and 959 arts and science colleges, 165 of them run by the government. Engineering colleges admitted 1,78,569 students in 2024-25 and polytechnics 58,426. Tamil Nadu’s college count rose from 2,610 in 2019-20 to 2,983 in 2023-24.
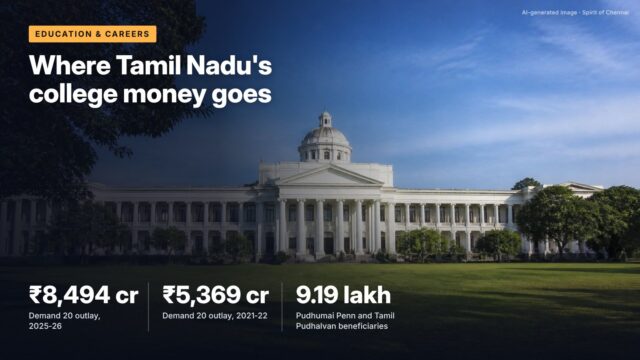
The third is money that follows the student. Under the Pudhumai Penn scheme, launched in 2022, women who studied in government schools receive ₹1,000 a month in college; the policy note counts 4,93,689 beneficiaries. The Tamil Pudhalvan scheme, launched in 2024 on the same terms for men, lists 4,25,346. The policy note does not separate the effect of these payments from other causes, and no official evaluation of their impact on enrolment was found for this article.
Tamil Nadu’s GER for Scheduled Caste students in 2022-23, against 27.3 for SC students nationally and 49.1 for all students in the state (Lok Sabha, August 2025).
Where the gaps are
The social-category rows are the most useful part of the 2022-23 table. Tamil Nadu’s Scheduled Caste GER of 41.4 is far above the national SC figure but almost eight points below the state’s overall ratio. For Scheduled Tribes the state figure is 43.8, with a wide gender gap: 48.2 for men and 39.4 for women. That is the reverse of the pattern for all students, where women are ahead.
Provisional numbers also move. The ministry’s provisional all-India ST ratio for 2022-23 was 23.5; the final 2022-23 report prints 22.6. State figures can shift in the same way between the version tabled in Parliament and the final report.
A further caution is ownership. Nationally, private unaided colleges held 44.6% of enrolment in 2021-22 and all private colleges together 65.2%, the AISHE 2021-22 report found. A high GER says nothing by itself about who pays the fees.
The latest national picture
The AISHE 2023-24 final report, uploaded on the AISHE portal in July 2026, puts India’s GER at 30.0, with women at 31.2 and men at 28.9. It names Tamil Nadu among the seven states that together hold 59% of national enrolment. Its state-wise ratio table was not in the text available for this article, so the Tamil Nadu figure above stays at the 2022-23 provisional value.
What this means for you
- When you see Tamil Nadu’s GER quoted, check the year and the population base. Figures from reports before 2020-21 are not comparable with current tables.
- GER counts enrolments, not graduates or jobs. For employment outcomes, look at placement and skilling data separately.
- If you are a woman who studied in a government school, or a man under Tamil Pudhalvan rules, the ₹1,000 monthly support is listed in the Higher Education policy note; confirm eligibility with your college.
- For institution-level checks, AISHE publishes each college’s reported data on its portal, which is useful before admission.
What to watch
AISHE 2023-24 state tables
The final report’s Table 19 will give Tamil Nadu’s 2023-24 ratio by gender and category on the 2011-projection base.
Pending: a new population base
Once results of the next Census are available, the ministry will need to re-base the 18 to 23 population, which will move every state’s GER again.
Checked against official sources on 23 October 2026. Figures and rules change; confirm on the linked official pages before relying on them.
Sources
- Lok Sabha Unstarred Question 4114, GER/GCR for Higher Education, Ministry of Education, 18 August 2025
- Lok Sabha Unstarred Question 93, Gross Enrolment Ratio in Higher Education, Ministry of Education, 4 December 2023
- All India Survey on Higher Education 2021-22, Ministry of Education
- AISHE Final Report 2022-23, Ministry of Education, 2026
- AISHE Final Report 2023-24, Ministry of Education, 2026
- Time series for GER based on 2011 population projection, AISHE, 2025
- AISHE Final Report 2019-20, Ministry of Education
- Higher Education Department Policy Note 2021-22, Government of Tamil Nadu
- Higher Education Department Policy Note 2025-26, Government of Tamil Nadu
- Lok Sabha Unstarred Question 170, school GER annexures, Ministry of Education, 3 February 2025